













What precision agriculture is and what field data actually change
Precision agriculture is a management strategy that uses spatial and temporal field data to vary operations within a field instead of treating every hectare alike. Its practical loop is to measure field conditions, analyse whether the variation is meaningful, apply an action at the required place and time, then measure the result.
Evidence from USDA and GAO reports, university extension guidance and peer-reviewed research shows how yield maps, soil tests, remote sensing, GNSS and machine records, and on-farm trials can alter site-specific decisions. The same evidence shows where those data can mislead.
What is precision agriculture, and what makes it different from whole-field management
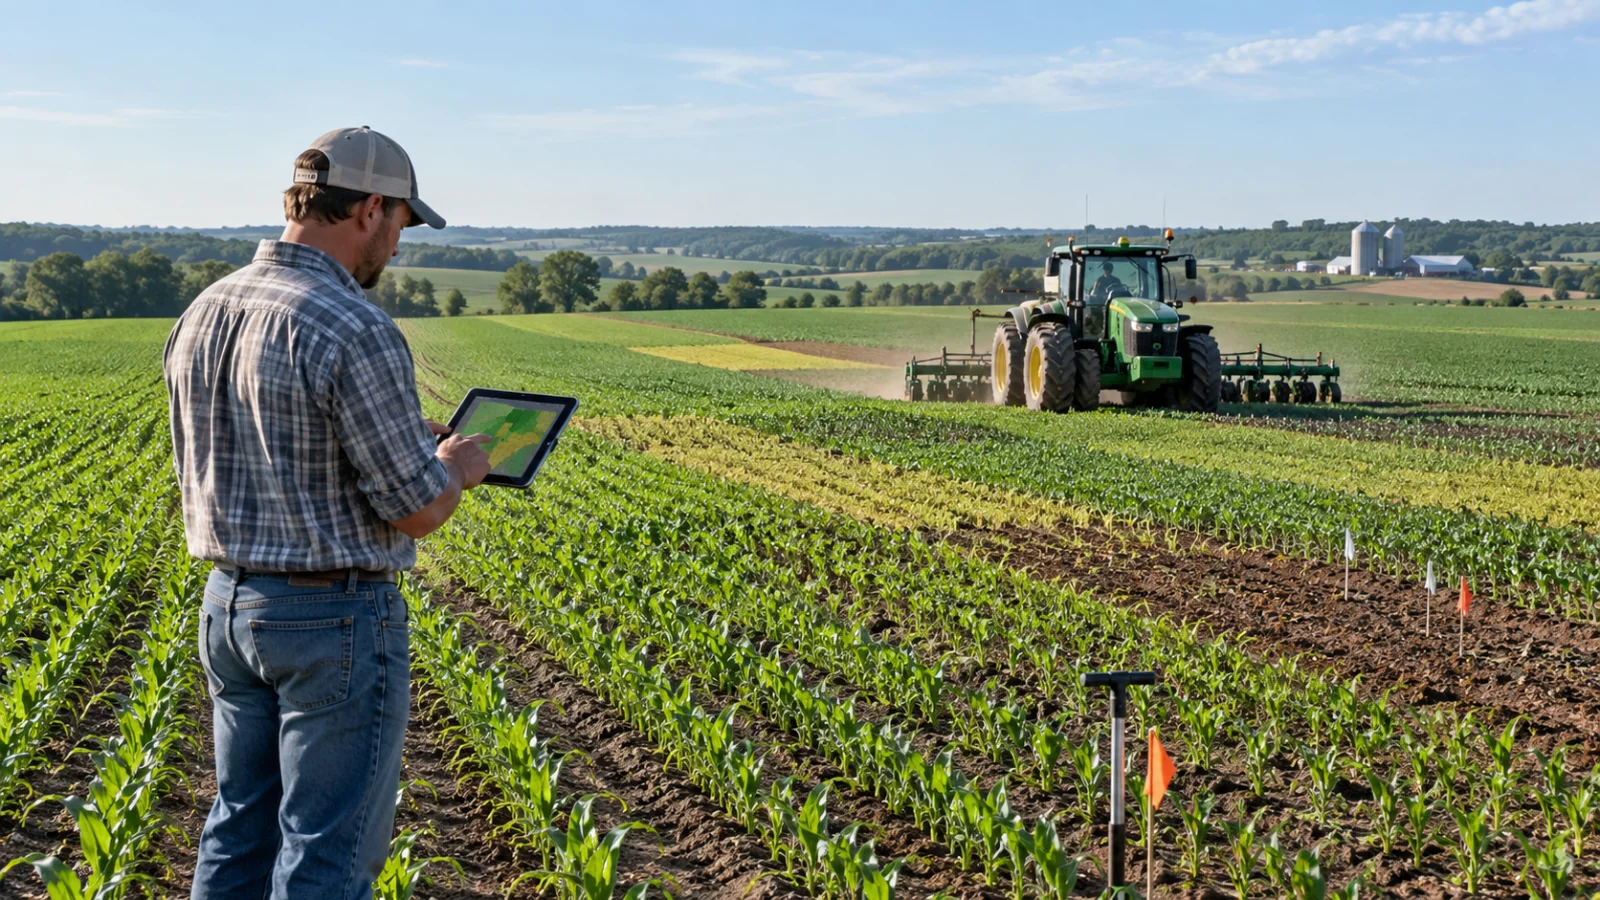
[Precision agriculture](/agriculture?sub=precision-agriculture) is a management strategy in which measurements of spatial and temporal variation are used to change operations within a field, rather than assuming that every part of the field should receive the same treatment. The practical loop is simple: measure conditions or outcomes, locate those measurements, analyse whether the variation is meaningful, choose an action, apply it at the required place and time, then measure the result. Finger et al. (2019) describe the same logic as site-specific sensing, sampling and management that allows a field to be treated as a heterogeneous unit.
That definition is broader than GPS guidance or a variable-rate spreader. Location technology makes measurements repeatable and lets machinery act on a prescription, but the agronomic value comes from the information and the decision rule. University of Missouri Extension (2026) therefore frames precision agriculture as an integrated crop-management system that matches the kind and amount of inputs to crop needs in smaller areas of a field.
The distinction matters because some precision technologies improve operations without diagnosing crop needs. Auto-steering, for example, can reduce overlap and make passes repeatable, but it does not by itself determine whether one zone needs more nitrogen or a different seed rate. Conversely, a soil or yield map may show a real pattern but still fail to justify a variable-rate action if the cause is unknown or if the available machinery cannot act on it.
In U.S. reporting, precision agriculture is already established but unevenly adopted. GAO reported in 2024, using 2023 USDA information, that 27% of U.S. farms or ranches used precision agriculture practices to manage crops or livestock (GAO, 2024). Farm size also matters: USDA data for 2023 show much higher adoption of guidance and variable-rate technologies on large-scale crop farms than on small farms (Lim et al., 2024). This pattern reflects economics and scale as much as agronomy.
Field data change a decision only when they are accurate enough, linked to a plausible agronomic cause and connected to an action that can be varied in space or time.
Which field data actually change precision agriculture decisions
Field data become decision-relevant when they do more than describe variability. They must identify a repeatable difference, support a plausible explanation for that difference, and connect to an action that can be changed in space or time. This is why precision agriculture usually works best with layers of information rather than a single map.
Yield data are outcome data. They show where the crop produced more or less under the combined effects of soil, weather, management and measurement error. Soil tests and terrain data are closer to explanatory data because they can identify constraints such as pH, nutrient status, texture, drainage or landscape position. Crop sensing and remote imagery add time-sensitive information about canopy development, temperature or reflectance, while machine logs record what was actually planted, sprayed or fertilised and where.
The most useful decision often comes from combining these categories. A low-yield zone that is consistently low across several seasons and also has a reproducible soil constraint may justify a different fertiliser, lime, seeding or drainage strategy. A low-yield patch that appears only in one drought year may instead represent weather exposure rather than a stable management zone. McBratney et al. (2005) identified inadequate treatment of temporal variation and weak decision-support systems as major barriers to turning precision data into management decisions.
On-farm experiments provide another kind of evidence: they deliberately create different management treatments and measure the response with field-scale equipment. In a 2025 study using 21 nitrogen strip trials across Australia, Colaço et al. found that trial design and the independence of observations mattered for models intended to support mid-season nitrogen decisions. Their results also indicated that regional models could outperform broader global models, reinforcing the point that decision rules must match the environment in which the data were collected.
A data layer becomes decision-relevant when a different value can change a feasible action. Soil pH can change a lime recommendation; a mapped phosphorus test can change where fertiliser is applied; repeated low yield can change whether a zone is intensified, investigated or managed for lower expected return; canopy temperature can trigger scouting for water stress; and an as-applied map can show whether a treatment was delivered as planned. Where no feasible management action follows from the measurement, the data remain descriptive rather than decision support.
How do yield maps and soil maps change input decisions
A calibrated yield monitor can reveal spatial patterns that are difficult to see from whole-field averages. University of Missouri Extension (2026) notes that yield measurements can help evaluate the effects of fertiliser, lime, seed, pesticides, tillage and irrigation, but also warns that one season can be dominated by weather. Several years of records are therefore more informative than one attractive map.
Longer time series can separate persistent zones from unstable ones. Blackmore (2000) analysed six years of yield data from a roughly 7 ha field and classified areas as high-yielding and stable, low-yielding and stable, or unstable. The point is not that these exact classes transfer to every farm; it is that repeated measurements can distinguish persistent production differences from year-to-year noise, which changes whether separate management is defensible.
Raw yield data also need quality control. Clarke et al. (2024) analysed a 10-year, 435 ha whole-farm yield dataset and removed 16% of observations during cleaning. When the cleaned maps were compared with independent weigh-cell records, wheat yield-map errors varied substantially, with root mean square error ranging from 0.53 to 1.53 t/ha. Their conclusion was that combine yield data should be validated before they are used to delineate management zones or support variable-rate decisions.
Soil sampling changes a different class of decision because it measures candidate causes directly. University of Missouri Extension (2026) gives a simple example: a traditional 20-acre sampling area can be subdivided into a 2-acre grid, producing 10 georeferenced samples instead of one composite sample. The resulting nutrient map can be converted into an application map for [variable-rate fertiliser equipment](/agriculture/fertilizer-types-rice-yield-soil-properties-sri-agriculture). The useful output is not the map itself but a rate prescription linked to measured soil differences and an agronomic interpretation.
This is also where economic judgement enters. A finer sampling grid costs more, and a variable-rate prescription is useful only if the within-field differences are large enough, persistent enough and responsive enough to management to repay the extra sampling, analysis and application cost. Schimmelpfennig (2016) found positive but small associations between several precision technologies and corn profits in 2010, on the order of 1–3%, which helps explain why technology can be valuable without being automatically profitable on every field.
What can remote sensing and machine data change during the season
Remote sensing adds speed and coverage. Mulla (2013) reviewed 25 years of remote sensing in precision agriculture and described the expansion from early visible and near-infrared measurements to a wider range of spectral and thermal sensing platforms. In practical terms, imagery can identify spatial crop differences quickly enough to direct scouting or to support in-season decisions about nutrients, irrigation or crop protection.
The limitation is that a sensor often measures a proxy, not the agronomic cause. A canopy with lower reflectance or higher temperature may be affected by water stress, nutrient deficiency, disease, compaction or stand loss. Remote sensing therefore changes a decision most reliably when the signal is compared with field observations, soil information or a known treatment response. University of Missouri Extension (2026) similarly notes that imagery can reveal crop stress but that interpretation is needed before it becomes a management prescription.
[Machine data](/agriculture/harmonized-forest-machine-data-dashboards-agriculture) provide the other side of the loop: what was actually done. GNSS positions, seeding logs, as-applied fertiliser maps, spray records and equipment telemetry can document rate, timing and location. These records can reveal overlaps, skips or deviations from a prescription and can be joined with later yield or sensor data to evaluate whether a treatment changed the outcome.
This operational value helps explain why guidance has often been adopted faster than more analytically demanding tools. USDA's 2023 farm data show guidance autosteering on 9% of small crop farms, 52% of midsize crop farms and 70% of large-scale crop farms; variable-rate technology was used by 5%, 32% and 45%, respectively (Lim et al., 2024). Guidance can deliver repeatability and labour benefits immediately, whereas variable-rate management depends on additional data, agronomic rules and compatible equipment.
Selected U.S. precision agriculture adoption by crop-farm size, 2023
Technology | Small farms | Midsize farms | Large-scale crop farms |
Guidance autosteering | 9% | 52% | 70% |
Variable-rate technology | 5% | 32% | 45% |
Percent of farms in each farm type using the technology. Source: USDA Economic Research Service using 2023 Agricultural Resource Management Survey data (Lim et al., 2024).
The wider research literature supports the potential of targeted input use, but not a guarantee of environmental benefit in every setting. Bongiovanni and Lowenberg-DeBoer (2004) concluded that site-specific management can reduce unnecessary input use, while also noting that relatively few studies at the time directly measured environmental outcomes such as leaching. Finger et al. (2019) likewise describe reduced waste as a central pathway to economic and environmental gains, but the realised benefit depends on how well the sensing and decision process identifies actual needs.
When do field data fail to support a decision
Precision data can fail at several points in the chain from measurement to action. The first is measurement error. Yield sensors require calibration, position data can be misaligned, machine logs can contain gaps, and soil or crop samples can be too sparse to represent a zone. A visually smooth map can therefore create false confidence if the underlying data have not been validated.
Remote sensing has the opposite problem: it can be timely but non-specific. Good decisions usually require either independent measurements that point to the same cause or an experiment that tests the proposed treatment.
The third failure is temporal transfer. A rule derived from one season may not work under a different rainfall pattern, crop rotation or price environment. McBratney et al. (2005) argued that temporal variation and whole-farm integration were under-recognised problems in precision agriculture. Blackmore's six-year analysis (2000) and the later whole-farm validation work of Clarke et al. (2024) show why multiple seasons can be necessary before a zone is treated as stable.
The fourth failure is analytical and practical compatibility. GAO (2024) reported that lack of common standards can hamper interoperability and make data quality harder to assess across devices and platforms. The same report highlighted high upfront costs and concerns about farm-data ownership and sharing. These barriers matter because a technically sound prescription has little value if data cannot move between systems or if a farm cannot economically act on it.
Finally, more data are not automatically better data. Colaço et al. (2025) found that thousands of spatially autocorrelated observations did not necessarily improve model performance over smaller sets of more independent observations in their 21 nitrogen trials. For decision support, sampling design, representativeness and a clear treatment question can matter more than raw data volume.
The fifth failure is economic mismatch. A statistically real difference does not necessarily justify a separate treatment if the affected area is too small, the response to treatment is weak, or the extra operational cost exceeds the value recovered. This is one reason the economics literature treats precision agriculture as a portfolio of technologies rather than a single intervention.
Schimmelpfennig's 2016 corn analysis found only modest profit effects on average, while USDA's later adoption data show that larger farms use the technologies more often (Lim et al., 2024). Scale can spread fixed equipment and software costs over more hectares, but it does not remove the need for field-specific evidence.
What is proven about precision agriculture, and what is not
The strongest conclusion is that precision agriculture can improve the resolution of farm management. It can locate variability, reduce overlap, document operations and support site-specific treatment where measurements identify differences that are agronomically meaningful and economically actionable. The evidence is also consistent that adoption and benefit are context-dependent rather than universal.
There is credible evidence for operational efficiency and for the possibility of reducing unnecessary inputs. GAO's 2024 technology assessment concluded that precision systems can improve resource management through more precise use of water, fertiliser and other inputs. Finger et al. (2019) and Bongiovanni and Lowenberg-DeBoer (2004) explain the same mechanism: information can substitute for some uniform input use by directing resources to places and times where they are more valuable.
What is not proven is that any particular data layer automatically produces a better decision. A single yield map is not a diagnosis, a vegetation index is not a nutrient test, and a variable-rate controller is not an agronomic model. The benefit depends on measurement quality, the stability of the pattern, the causal link between the measured variable and the treatment, and the cost of acting on the prescription.
The evidence therefore favours selective, question-driven data collection over collecting every available layer. Measurements are most useful when they are validated, compared with independent field evidence and, where uncertainty remains, tested against an observed treatment response. Precision agriculture adds value when it makes a management decision more specific and testable, not merely more digital.
Frequently asked questions
Is precision agriculture the same as GPS farming?
No. GPS and GNSS provide location and repeatability, but precision agriculture is the wider management strategy. It also includes soil and crop sensing, yield mapping, machine records, remote imagery, on-farm experiments and decision rules that use those data to change an operation within a field.
Does precision agriculture always reduce fertiliser use?
No. Variable-rate management can reduce application in zones that need less, but it can also increase rates where a measured deficiency or response justifies more input. The relevant outcome is better matching of rate to need, not simply using less fertiliser everywhere.
How many years of yield data are useful?
There is no universal minimum. One season can be dominated by weather, while multi-year maps can reveal whether low- or high-yield areas are persistent. Research using six- and ten-year datasets shows why repeated observations are valuable, but the maps still need calibration, cleaning and agronomic interpretation.
Can drones replace soil sampling?
Not generally. Drone and satellite imagery can reveal crop patterns quickly, but reflectance or temperature signals often have several possible causes. Soil sampling directly measures properties such as pH or nutrient status, so imagery is usually more useful for directing scouting or adding context than replacing ground measurements.
Is precision agriculture only for large farms?
No. USDA data show higher adoption of guidance and variable-rate technology on larger U.S. crop farms, where fixed costs can be spread over more hectares. Smaller farms can still use selected tools or custom services when the expected decision value justifies the cost.
Sources
- U.S. Government Accountability Office. Precision Agriculture: Benefits and Challenges for Technology Adoption and Use. GAO-24-105962. 2024. Address: www.gao.gov/products/gao-24-105962.
- Lim K, McFadden J, Miller N, Lacy K. America's Farms and Ranches at a Glance: 2024 Edition. U.S. Department of Agriculture, Economic Research Service. EIB-283. 2024. DOI 10.32747/2024.8754620.ers.
- Schimmelpfennig D. Farm Profits and Adoption of Precision Agriculture. U.S. Department of Agriculture, Economic Research Service. Economic Research Report 217. 2016. Address: www.ers.usda.gov/publications/80325.
- University of Missouri Extension. Precision Agriculture: An Introduction. Publication WQ450. Reviewed March 2026. Address: https://extension.missouri.edu/publications/wq450.
- McBratney A, Whelan B, Ancev T, Bouma J. Future Directions of Precision Agriculture. Precision Agriculture. 2005;6:7–23. DOI 10.1007/s11119-005-0681-8.
- Finger R, Swinton SM, El Benni N, Walter A. Precision Farming at the Nexus of Agricultural Production and the Environment. Annual Review of Resource Economics. 2019;11:313–335. DOI 10.1146/annurev-resource-100518-093929.
- Mulla DJ. Twenty five years of remote sensing in precision agriculture: Key advances and remaining knowledge gaps. Biosystems Engineering. 2013;114(4):358–371. DOI 10.1016/j.biosystemseng.2012.08.009.
- Clarke DE, Stockdale EA, Hannam JA, Marchant BP, Hallett SH. Whole-farm yield map datasets - Data validation for exploring spatiotemporal yield and economic stability. Agricultural Systems. 2024;218:103972. DOI 10.1016/j.agsy.2024.103972.
- Bongiovanni R, Lowenberg-DeBoer J. Precision Agriculture and Sustainability. Precision Agriculture. 2004;5:359–387. DOI 10.1023/B:PRAG.0000040806.39604.aa.
- Colaço AF, Bramley RGV, Richetti J, Lawes RA. What makes on-farm experimental data suitable for data-driven decision-making? Implications of trial design and spatial distribution of field data for machine learning models. Precision Agriculture. 2025;26:85. DOI 10.1007/s11119-025-10280-y.
- Blackmore S. The interpretation of trends from multiple yield maps. Computers and Electronics in Agriculture. 2000;26(1):37–51. DOI 10.1016/S0168-1699(99)00075-7.
Anjali Dhanjal — author
Anjali Dhanjal is a plant science specialist with a degree in Plant Science and a master’s-level specialization in Plant Breeding. Her earlier work involved preparing reviews of variety trials and crop genetics research for farmers, translating scientific find...
Related
How harmonised forest machine data supports dashboard control
How fertiliser types affect rice yield and soil under SRI
How Orchard Age and Herbicides Shift Soil Nitrogen and N2O
Glyphosate’s Rise to Top Weedkiller: A 1997 Account
What crop rotation is, from the three-field system to today
How crop rotation works and why it improves soil fertility
Why Punjab Farmers Burn Stubble and What Fire Counts Show