













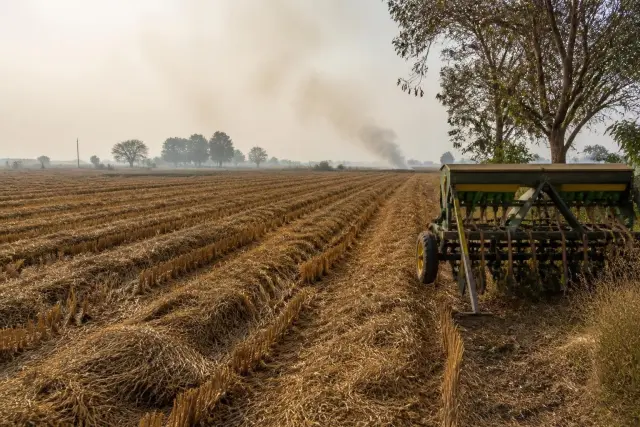


How much milk does a cow produce a day and what affects yield
On a US national basis, USDA data for April 2026 work out to about 69 lb (31.3 kg) of milk per cow per day (USDA NASS, 2026a), while lactation stage, breed, parity, feed intake, heat, housing, milking frequency and udder health can shift that output. That is a population average, not the expected output of every lactating cow, because the USDA cow count includes dry cows.
This article explains how daily, monthly and annual measures relate, then examines lactation stage, breed, parity, feed intake, heat, housing, milking frequency and udder health. It draws on USDA statistics, peer-reviewed dairy research and a National Academies nutrition review.
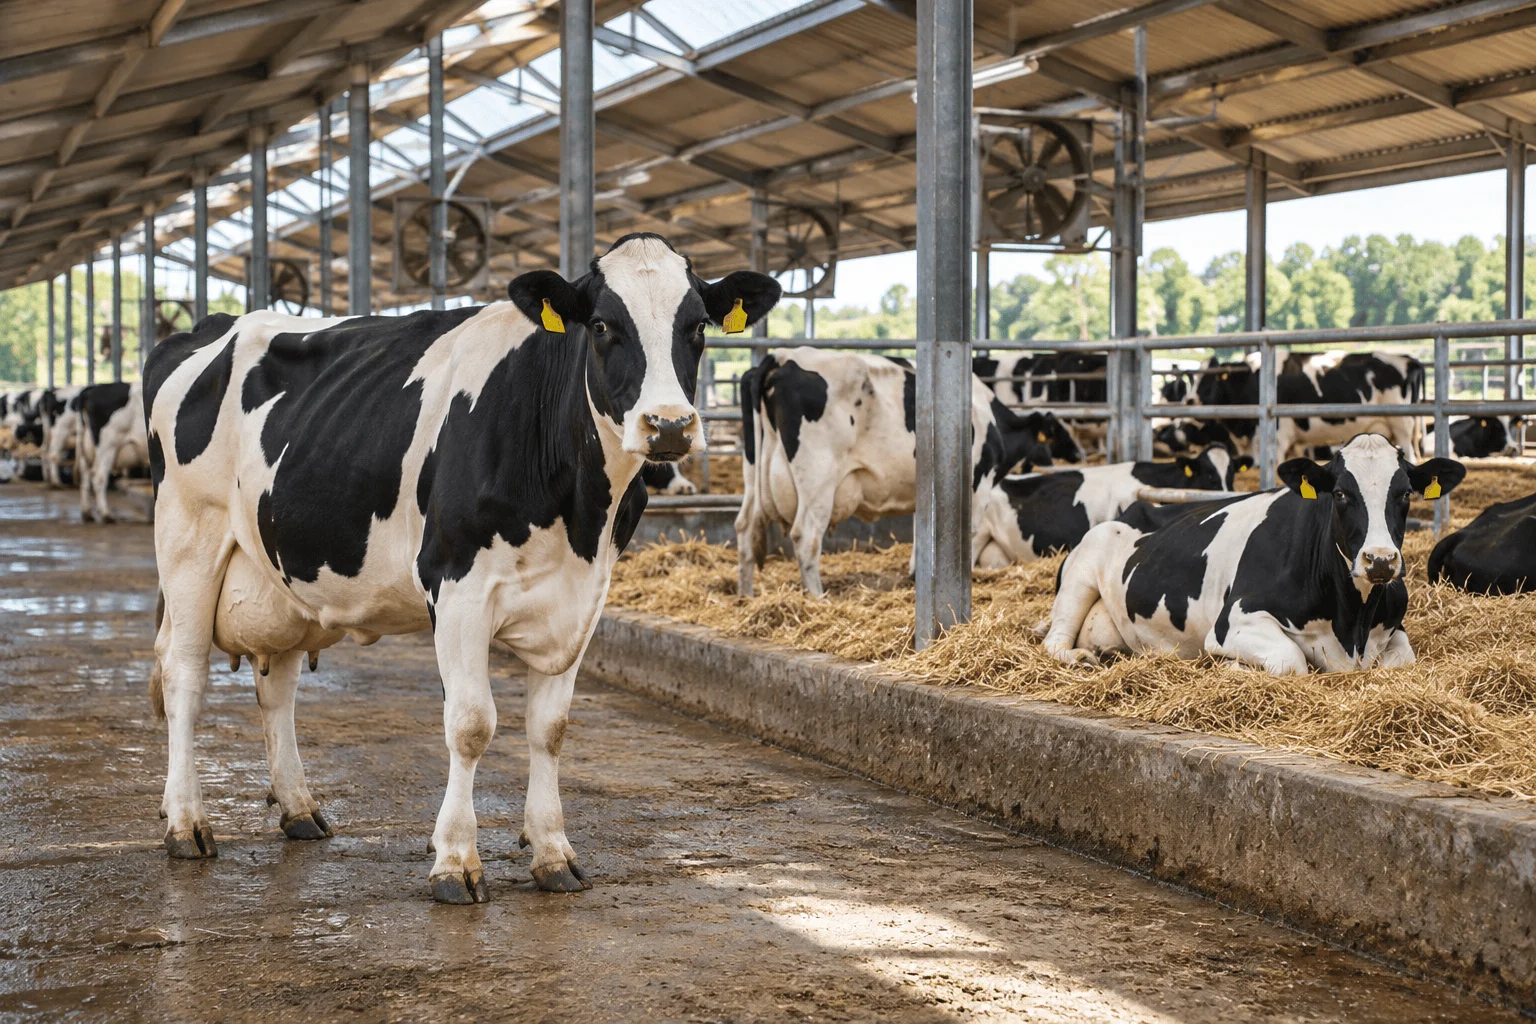
How much milk a dairy cow produces in a day
A useful national benchmark comes from the US Department of Agriculture, but it needs careful interpretation. USDA NASS reported that US milk production in April 2026 averaged 2,069 lb per cow for the month. Dividing that monthly rate by 30 days gives about 69.0 lb, or 31.3 kg, per cow per day (USDA NASS, 2026a). The same report states that its cow count includes dry cows and excludes heifers that have not yet calved, so the figure is an average across the national milk-cow inventory rather than the measured output of one typical lactating animal.
The annual picture is similar. USDA NASS reported 24,390 lb per cow for 2025; spread evenly across 365 days, that is about 66.8 lb, or 30.3 kg, per day (USDA NASS, 2026b). The annual average smooths over high-output weeks in early and mid lactation, lower-output weeks later in lactation and periods when a cow is dry. It therefore answers a population-level question, not the question of what every cow standing in a milking parlour will give on a particular morning.
Monthly, annual and individual measures
A daily figure can be calculated from a monthly or annual report, but the denominator matters as much as the milk total. USDA's production-per-cow measure divides reported milk production by the estimated number of milk cows on farms, including animals in the dry period (USDA NASS, 2026a). By contrast, a farm record may average only cows currently contributing milk to the tank, and an individual test-day record measures a particular cow at a particular stage of lactation. Those three numbers can all be correct while being noticeably different.
The national rate is therefore best used as a scale marker. It says that US dairy production is roughly in the low-30-kilogram-per-cow-per-day range when the whole milk-cow population is averaged, not that 31 kg is a biological norm or a target for every animal (USDA NASS, 2026a; USDA NASS, 2026b). A high-producing cow near peak lactation can be far above the national daily equivalent, while a late-lactation cow may be below it and a dry cow is not producing saleable milk on that day.
Source | Population / conditions | Measure | Result |
USDA NASS, Apr 2026 | US milk-cow inventory; dry cows included | 2,069 lb/cow/month | 69.0 lb/day (31.3 kg/day), derived over 30 days |
USDA NASS, 2025 | US annual average milk-cow inventory | 24,390 lb/cow/year | 66.8 lb/day (30.3 kg/day), derived over 365 days |
Walsh et al., 2024 | Pasture-based cows, first 12 weeks | Parity 1 / 2 / 3 milk yield | 19.6 / 24.1 / 26.3 kg/day |
Almeida et al., 2026 | 30 matched Holstein-Jersey studies | Breed difference in milk yield | Jersey -10.8 kg/day vs Holstein |
Beaudry et al., 2026 | 5 Wisconsin automated-milking herds, days 22–150 | Early milking frequency association | At least 3 milkings/day: +2.7 kg/day |
An average of about 30 to 31 kg of milk per cow per day describes a population, not a fixed biological output (USDA NASS, 2026a; USDA NASS, 2026b). Stage of lactation and herd composition determine what that average means.
How do cows make milk
Milk is made in the mammary glands of the udder, not simply collected there from elsewhere in the body. A cow's udder has four quarters containing small milk-secreting structures called alveoli, where specialised epithelial cells take up nutrients from the blood and synthesise milk components. These cells produce lactose, milk proteins and fat and release them into spaces that connect with the udder's duct system (Jaswal et al., 2022).
The mammary gland develops during pregnancy, but a major increase in secretion takes place around calving. A fall in progesterone, alongside changes in prolactin and other hormones, allows milk-secreting cells to become more active; the earliest secretion is colostrum, which differs from mature milk. This transition, known as lactogenesis, connects milk production to the cow's reproductive cycle (Jaswal et al., 2022).
Producing milk is not the same as releasing it during milking. Between milkings, milk accumulates mainly in the alveolar compartment, and stimulation from a suckling calf or milking equipment causes oxytocin release and contraction of cells surrounding the alveoli. This milk-ejection reflex moves milk towards the teat, while the amount synthesised over time depends on mammary cell activity, nutrient supply and stage of lactation (Bruckmaier, 2005; Jaswal et al., 2022).
Milk yield changes across the lactation
Milk production follows a curve rather than staying flat after calving. A 2023 review by Cole and colleagues describes a rapid rise in early lactation, with peak production commonly occurring around 46 to 55 days in milk, followed by a gradual decline as lactation progresses (Cole et al., 2023). Peak level, the rate of decline after the peak and total lactation length together determine how much milk a cow produces over the whole lactation. This pattern is why the phrase 'milk per day' needs a time point attached to it when an individual cow is being discussed.
A single test day can therefore misrepresent what the whole lactation looks like. A cow measured near peak is being observed at the most productive part of the curve, whereas an annual herd statistic mixes many cows before, at and after peak. Standardised lactation totals, such as 305-day records used in dairy recording systems, are designed to compare performance over a longer common window rather than treating one day's yield as the cow's permanent level (Cole et al., 2023).
Early lactation also brings a mismatch between rising milk output and the amount of feed a cow can consume. The National Academies' 2021 dairy nutrition review treats dry matter intake and energy supply as central constraints because nutrient demand for milk can rise faster than intake after calving (National Academies, 2021). That is one reason stage of lactation cannot be separated cleanly from feeding and body-reserve use when interpreting yield. Later in lactation, both milk demand and the biological drive for peak production ease, so the same diet does not necessarily produce the same daily volume.
Breed, age and parity change the baseline
Breed changes both milk volume and milk composition. In a 2026 meta-analysis of 30 peer-reviewed experiments that compared purebred Holstein and Jersey cows under similar study conditions, Jerseys produced 10.8 kg less milk per day on average than Holsteins, while Jersey milk had higher fat and true-protein concentrations (Almeida et al., 2026). That result does not mean every Holstein out-produces every Jersey; it shows a breed-level difference across matched research comparisons, and it also illustrates why litres or kilograms of milk alone do not describe the amount of milk solids produced.
Parity, meaning the number of times a cow has calved, also shifts expected production. Walsh and colleagues followed 80 spring-calving cows during the first 12 weeks of lactation in a pasture-based system and found average daily milk yields of 19.6 kg for first-parity cows, 24.1 kg for second-parity cows and 26.3 kg for third-parity cows (Walsh et al., 2024). In that study, dry matter intake rose with parity as well, so older cows were both eating more and producing more during early lactation. The result is specific to that pasture-based system but matches the broader expectation that first-lactation animals often produce less than mature cows.
Age and parity are related but are not interchangeable with genetic potential or health. First-lactation cows are still allocating nutrients to their own growth, whereas mature cows may have greater body capacity and a more developed mammary system. At the same time, production does not simply rise forever with age: later parities can bring more accumulated health events, and the exact pattern depends on breed, herd and culling decisions. The 2023 review by Cole and colleagues also emphasises that decades of selection have moved the whole production curve upward, so comparisons across generations of dairy cattle require genetic context as well as age (Cole et al., 2023).
Feed, heat and housing shift daily production
Daily milk yield depends on both the nutrients available to a cow and the conditions in which she uses them. Feed intake and energy supply help determine how much production can be sustained, while heat stress and housing conditions can affect the consistency of that output (National Academies, 2021; Özcan and Dikmen, 2026).
Feed intake and energy supply
Milk synthesis requires a large daily flow of energy, protein, water and other nutrients, so intake places a practical ceiling on output. The National Academies' 2021 review links predicted dry matter intake to body weight, milk production, days in milk, parity and environmental conditions rather than treating feed intake as a fixed number (National Academies, 2021). This is important because two cows offered the same ration can have different intakes and different milk responses. It also means that a low daily yield cannot be assigned to one nutrient from production data alone.
The relationship also runs in both directions: cows with greater milk potential generally require more intake, while limitations in intake can reduce the amount of energy available for milk. In the 2024 pasture study by Walsh and colleagues, third-parity cows averaged 17.7 kg of dry matter intake and 26.3 kg of milk per day, compared with 13.2 kg of dry matter and 19.6 kg of milk in first-parity cows during the first 12 weeks after calving (Walsh et al., 2024). Those numbers describe one pasture-based experiment, not a universal conversion rate from feed to milk. Feed quality, digestibility, body size, climate and stage of lactation all modify the relationship.
Heat and the housing environment
Heat load can push production downward even when genetics and ration formulation have not changed. A 2026 meta-analysis combined 35 independent studies published from 2010 to 2023 and found a significant negative association between heat stress and milk yield, with a pooled effect size of d = -0.723 (Özcan and Dikmen, 2026). The authors reported substantial heterogeneity for milk yield (I² = 89.165%), indicating that the measured effect varied widely between studies (Özcan and Dikmen, 2026). Their subgroup analyses suggested larger declines at higher temperature-humidity index values, but they cautioned against treating one threshold as universal.
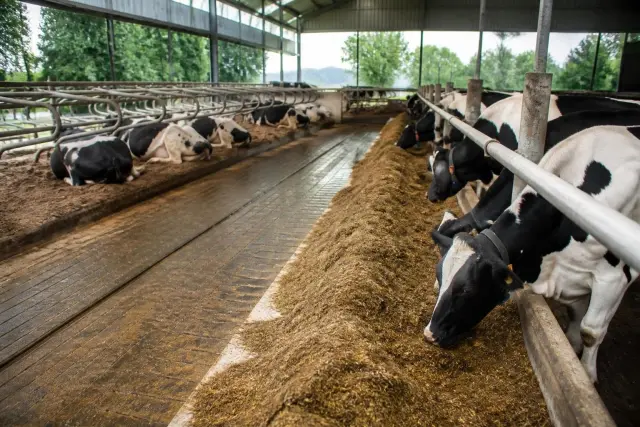
Housing and stocking conditions matter because they can alter access to feed, lying time and competition. Evidence on direct milk-yield effects is less consistent than evidence on behaviour, so crowding should not be converted into a single expected loss in kilograms. The site's article on [overstocking and dairy cow welfare](/animals/dairy-cow-welfare-animals) summarises why stall and feed-space pressure can change behaviour without implying that every crowded herd will show the same production response. In practice, housing is one part of the environment through which feed access, rest, heat load and social competition can interact.
Milking frequency, health and herd management affect output
Milk yield also responds to milking routines and the health of individual animals. More frequent milking can be associated with greater daily output, while repeated mastitis events may reduce production over time (Erdman and Varner, 1995; Costa et al., 2025). Herd management shapes how these effects appear in farm-level averages.
Milking frequency
How often milk is removed can change daily yield, but the effect depends on stage of lactation and production system. A synthesis of 19 reports published by Erdman and Varner in 1995 found that milking three times daily rather than twice daily was associated with 3.5 kg more milk per day on average, with a 95% confidence interval from 3.1 to 3.9 kg/day (Erdman and Varner, 1995). Those studies were conducted in older management systems, so the number is best read as evidence that frequency can matter, not as a guaranteed modern response for every herd.
A newer commercial-herd analysis reached the same directional conclusion while showing that the relationship is not simply linear. Beaudry and colleagues analysed data from five Wisconsin herds using automated milking systems and found that cows averaging at least three milkings per day early in lactation produced 2.7 kg/day more milk from days 22 to 150 than cows below that frequency threshold (Beaudry et al., 2026). Because cows choose or are guided into automated systems at different rates, this observational association cannot prove that extra milkings alone caused the whole difference. Higher-producing cows may also visit or be selected for milking more often.
Health and herd management
Health events can depress yield directly and can also change the shape of the rest of a lactation. Costa and colleagues analysed Austrian Fleckvieh records and found that cows with repeated mastitis events had lower milk yield and lactose content than cows without those inflammation events; the study concluded that cumulative udder inflammation can have lasting effects on mammary function (Costa et al., 2025). This is evidence about production loss, not a treatment protocol. It also shows why an average yield number can partly reflect the health history of the cows that make up the herd.
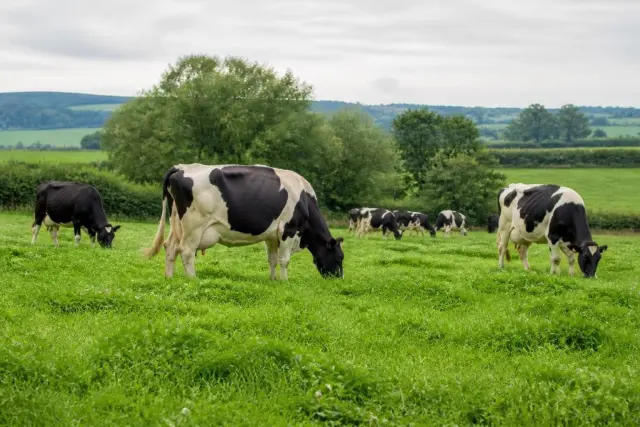
Management influences how all of the other factors are expressed. Grouping, feed access, milking routines, heat exposure and the distribution of cows across stages of lactation can move a herd average even when the individual cows' genetic potential is unchanged. Historical examples also show how health and pasture conditions can reduce production; the site's article on [cattle scouring and milk loss on teart pastures](/animals/teart-pastures-molybdenum-cattle-animals) is one such case, but it describes a specific mineral-related problem rather than a general explanation for low yield. This is why low production is a description of an outcome, not a diagnosis of its cause.
What the evidence does and does not show
The strongest conclusion is that there is no single biological daily output for 'a cow'. In the USDA release of 22 May 2026 used here, April production averaged 2,069 lb per cow, equivalent to about 69.0 lb (31.3 kg) per day when divided across the 30-day month (USDA NASS, 2026a). The 2025 annual statistic gives a similar daily equivalent of about 66.8 lb, or 30.3 kg (USDA NASS, 2026b). Those figures are useful for scale, but they average across cows at different stages of lactation and include dry cows in the inventory.
Research is also consistent about the direction of several important effects. Milk rises to a peak and then declines through lactation; Holsteins generally produce more milk volume than Jerseys in matched comparisons; later-parity cows often out-produce first-lactation cows; heat stress is associated with lower yield; and greater milking frequency is often associated with higher output (Cole et al., 2023; Almeida et al., 2026; Walsh et al., 2024; Özcan and Dikmen, 2026; Beaudry et al., 2026). The exact size of each effect is not fixed because the studies use different breeds, climates, diets, herds and management systems.
A herd average is therefore a summary of a changing population, not a ceiling or a target for every animal. It should not be compared directly with the peak yield of one high-producing cow without matching stage of lactation, parity, breed and measurement period. Milk yield reflects interacting biological and management factors, and the size of any single effect cannot be assumed to be the same in every herd. For a reader trying to interpret a farm's number, the first question is not whether it is high or low in isolation, but what population and time window the number represents.
Frequently asked questions
Does a dry cow still produce milk?
During the dry period, a dairy cow is not being milked commercially. This interval separates one lactation from the next and is one reason herd-level production figures need careful interpretation. USDA cow inventories can include dry cows, so average milk per cow does not represent the output of every lactating animal.
How many litres of milk can one cow give in a day?
Milk is usually reported by weight in research and USDA statistics, which avoids assumptions about density. A high-producing lactating cow can give substantially more than the national per-cow average, while late-lactation cows give less. The exact daily amount depends on breed, parity, stage of lactation, environment, feeding and health.
When does a dairy cow produce the most milk?
Milk yield usually rises quickly after calving and reaches a peak in early lactation. A 2023 review places the common peak around 46 to 55 days in milk, after which yield generally declines. The timing and height of the peak vary with genetics, parity, nutrition, health and management.
Do Holstein cows produce more milk than Jersey cows?
On average, Holsteins produce more milk volume. A 2026 meta-analysis of 30 matched studies found Jersey cows produced 10.8 kg less milk per day than Holsteins, while Jersey milk contained more fat and true protein. Individual cows can differ widely, so breed averages do not predict every animal.
Why can a cow's milk production drop from one month to the next?
A lower monthly yield can reflect normal movement down the lactation curve, heat stress, changes in feed intake, health events, milking frequency or shifts in herd composition. Because these factors can occur together, a drop in milk volume alone does not identify a single cause or show which factor contributed most.
Sources
- USDA National Agricultural Statistics Service. Milk Production. Released 22 May 2026. Washington, DC: USDA NASS. https://esmis.nal.usda.gov/sites/default/release-files/795915/mkpr0526.pdf
- USDA National Agricultural Statistics Service. Milk Production, Disposition, and Income 2025 Summary. Released 30 April 2026. Washington, DC: USDA NASS. https://esmis.nal.usda.gov/sites/default/release-files/795884/mlkpdi26.pdf
- Cole JB, Makanjuola BO, Rochus CM, van Staaveren N, Baes C. The effects of breeding and selection on lactation in dairy cattle. Animal Frontiers. 2023;13(3):62–70. doi: 10.1093/af/vfad044.
- Almeida KV, Sacramento JP, Reyes DC, Oliveira AS, Martineau R, Brito AF. A meta-analysis and meta-regression to compare the production performance, feed efficiency, and milk N efficiency in Jersey versus Holstein cows. Journal of Dairy Science. 2026;109(7):6891–6914. doi: 10.3168/jds.2025-26913.
- Walsh S, Delaby L, Kennedy M, Galvin N, McKay ZC, Egan M. Intake profile, milk production, and energy balance of early-lactation spring-calving Holstein Friesian and Jersey × Holstein Friesian dairy cows in high-utilization pasture-based systems. Journal of Dairy Science. 2024;107(10):8058–8071. doi: 10.3168/jds.2023-24517.
- Özcan Ö, Dikmen S. The effects of heat stress on milk yield and composition in dairy cattle: meta-analysis study. Veterinary and Animal Science. 2026;34:100729. doi: 10.1016/j.vas.2026.100729.
- Erdman RA, Varner M. Fixed yield responses to increased milking frequency. Journal of Dairy Science. 1995;78(5):1199–1203. doi: 10.3168/jds.S0022-0302(95)76738-8.
- Beaudry J, Foltz J, Burney S, Peña-Lévano L, Nicholson CF. Economic analysis of early-lactation milking frequency in automated milking systems. Journal of Dairy Science. 2026;109(10):10600–10609. doi: 10.3168/jds.2025-28013.
- Costa A, Bovenhuis H, Egger-Danner C, Fuerst-Waltl B, Boutinaud M, Guinard-Flament J, Obritzhauser W, Visentin G, Penasa M. Mastitis has a cumulative and lasting effect on milk yield and lactose content in dairy cows. Journal of Dairy Science. 2025;108(1):635–650. doi: 10.3168/jds.2024-25467.
- National Academies of Sciences, Engineering, and Medicine. Nutrient Requirements of Dairy Cattle: Eighth Revised Edition. Washington, DC: National Academies Press; 2021. doi: 10.17226/25806.
- Jaswal S, Jena MK, Anand V, Jaswal A, Kancharla S, Kolli P, Mandadapu G, Kumar S, Mohanty AK. Critical Review on Physiological and Molecular Features during Bovine Mammary Gland Development: Recent Advances. Cells. 2022;11(20):3325. DOI 10.3390/cells11203325.
- Bruckmaier RM. Normal and disturbed milk ejection in dairy cows. Domestic Animal Endocrinology. 2005;29(2):268–273. DOI 10.1016/j.domaniend.2005.02.023.

Lena Okonjo — author
Lena Okonjo is a Zoology graduate with a master’s-level specialization in Animal Behaviour. Her earlier work involved preparing summaries of field studies on animal behaviour and insects for general audiences. At Cabdirect, Lena covers animal behaviour, insect...
Related
Overstocking and Dairy Cows: Lessons from a 2012 Review
Teart Pastures in Somerset: Molybdenum and Cattle Scouring
Hereditary dwarfism in beef cattle: genetics and calf outcomes
Eastern Europe's native poultry genetic resources in 1996
Monarch butterfly migration and how monarchs find their way
How long do bees live: workers, drones and queens compared

Why do cats knead and make biscuits on blankets and people