










The carbon cycle and how carbon moves between air, land and sea
The carbon cycle is the set of exchanges that move carbon between the atmosphere, living things, soils, rocks and the ocean, and it runs on two very different timescales (Berner, 2003). Land plants alone take up about 123 billion tonnes of carbon a year through photosynthesis, while the slow exchange with rocks works over millions of years (Beer et al., 2010; Berner, 2003).
This explainer follows where carbon sits, how it moves, how much of it human activity has added and how the additional carbon is currently being shared out between air, land and sea. It also sets out which parts of the picture are measured directly and which rest on models that still disagree.
What the carbon cycle is and how it works
Carbon does not sit still. It moves between the air, living tissue, soils, sediments, rocks and sea water, and the same atom can pass between several of these over a lifetime. What makes the cycle hard to picture is that two cycles run at once, at speeds that differ by a factor of millions.
The quantities involved are usually given in billions of tonnes of carbon, counting the carbon itself rather than the whole carbon dioxide molecule. The two units differ by a factor of about 3.7, which is why the 2023 total reported by Friedlingstein and colleagues in the Global Carbon Budget appears as 11.1 ± 0.9 billion tonnes of carbon in one source and 40.6 billion tonnes of carbon dioxide in another (Friedlingstein et al., 2025).
The fast cycle
The fast cycle is biological. Plants and plankton take carbon dioxide out of the air or the surface water and build it into tissue, and respiration, decay and fire return it. Global net primary production, the carbon that producers keep after their own respiration, is about 104.9 billion tonnes of carbon a year, split roughly evenly between land and ocean (Field et al., 1998).
In a 2010 analysis, Beer and colleagues combined flux-tower records with model estimates and put land gross primary production at about 123 billion tonnes of carbon a year, with tropical forests and savannahs accounting for around 60% of it (Beer et al., 2010). These are the flows that make atmospheric CO2 rise and fall with the seasons as the northern growing season starts and ends.
Because the two hemispheres have unequal land areas, the fast cycle leaves a visible signature in the air itself. Atmospheric carbon dioxide dips through the northern summer as vegetation grows and climbs again as that growth decays, producing an annual sawtooth on top of the long-term trend in the monitoring record (NOAA, 2026).
The slow cycle
The slow cycle moves carbon between rocks and the Earth's surface over millions of years, through weathering, burial of organic matter and volcanic return (Berner, 2003). Calculations across the Phanerozoic, the last 550 million years, show how this exchange governed the burial of organic matter, the formation of fossil fuels and the composition of the atmosphere itself (Berner, 2003).
The distinction matters for reading the news. Burning fossil fuels takes carbon that the slow cycle locked away over hundreds of millions of years and releases it into the fast cycle in a couple of centuries. The slow cycle cannot absorb it back at anything like that rate.
What are the steps of the carbon cycle?
Written as a sequence, the fast cycle has four recurring steps, and each one is a measurable flow rather than a stage that has to finish before the next begins. All four run continuously and in both directions.
- Uptake: plants on land and phytoplankton at sea convert carbon dioxide into organic matter through photosynthesis (Field et al., 1998).
- Transfer: that carbon moves through food webs, root systems and sinking marine particles.
- Return: respiration, decomposition and fire release carbon dioxide back to the air, while part of the soil carbon is stabilised instead of being respired (Jackson et al., 2017).
- Exchange with the ocean: carbon dioxide dissolves into sea water and comes back out, with a net transfer into the ocean while atmospheric concentrations keep rising (Gruber et al., 2019).
The slow cycle adds two more steps that work on geological time. The weathering of rock consumes carbon dioxide, and burial in sediments locks carbon away until volcanism eventually returns it to the air (Berner, 2003).
Listing these as steps is a teaching device rather than a description of a queue. Uptake, transfer, return and ocean exchange all happen at once, in every season, and the net result at any point is a small difference between two very large opposing flows. That is why a change of a few per cent in either direction shows up clearly in the atmosphere.
Where the carbon is actually stored
Stores and flows are different questions, and mixing them is the most common error in popular accounts. A reservoir can be very large and still exchange slowly, and a flow can be very large while the pool it passes through stays small.
Plants, soils and frozen ground
A census of life on Earth puts total biomass at roughly 550 billion tonnes of carbon, of which plants account for about 450 billion tonnes, bacteria about 70 and all animals about 2 (Bar-On et al., 2018). Marine life, despite the size of the ocean, holds only about 6 billion tonnes (Bar-On et al., 2018).
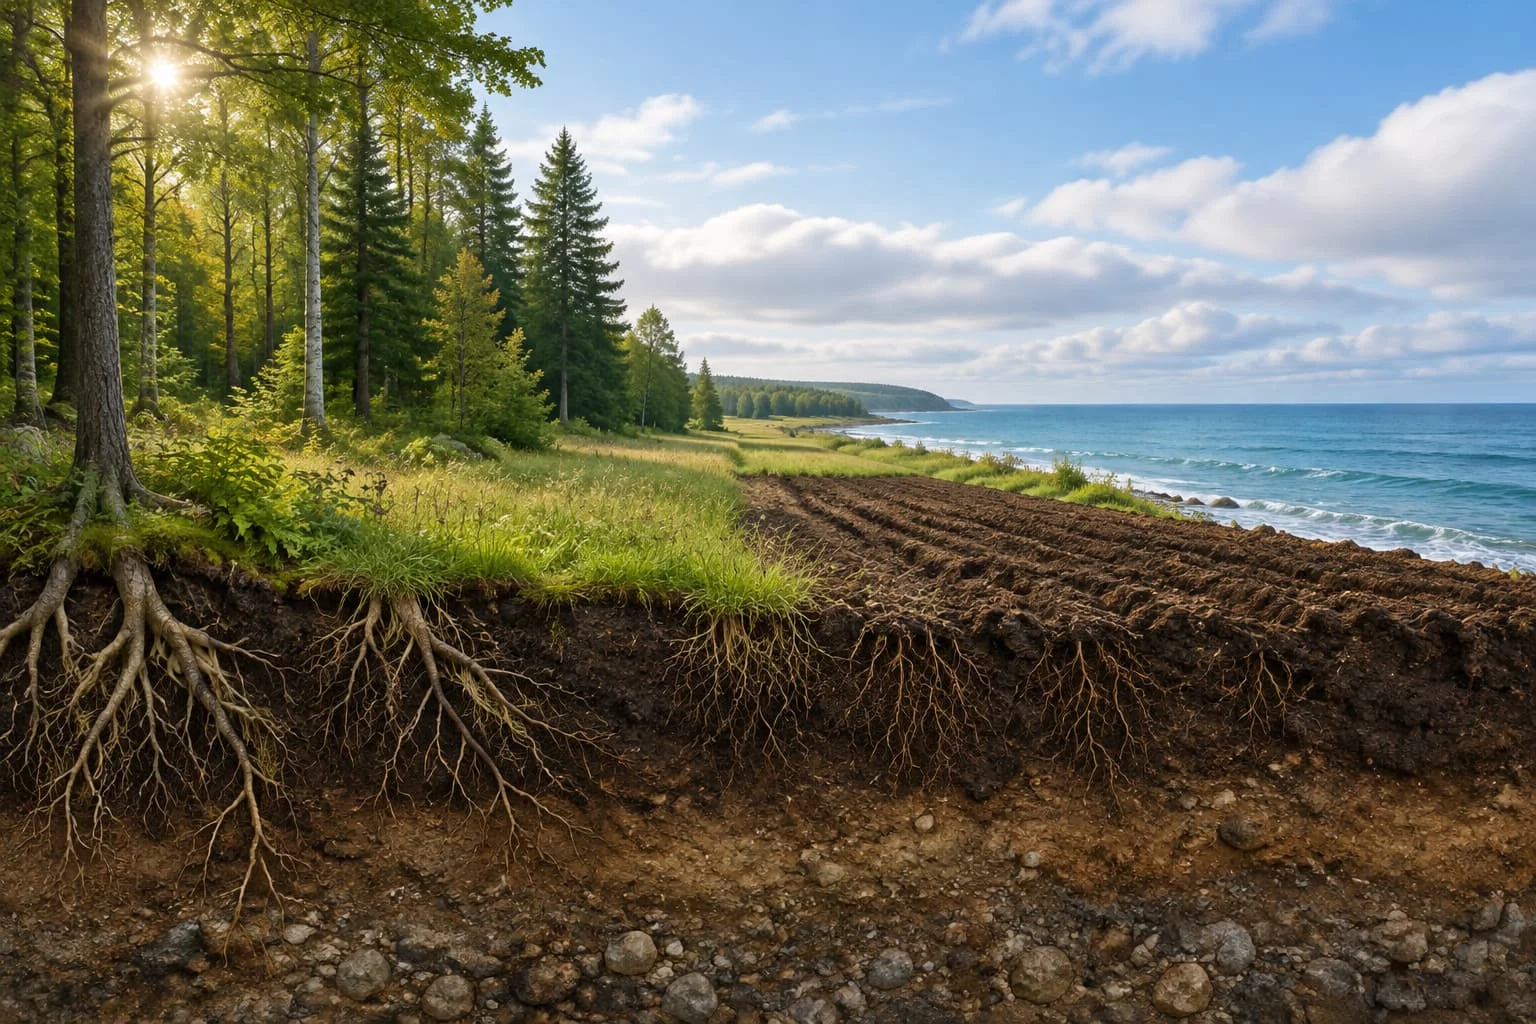
Soil holds more than the living world above it. Soil organic matter stores more carbon than plants and the atmosphere combined, and root inputs are roughly five times more likely than an equivalent mass of leaf litter to end up stabilised in it (Jackson et al., 2017). Work on the carbon balance of boreal forest bioenergy shows how slow that stored carbon is to rebuild once it is released.
Frozen ground is a store of its own. Soils of the northern permafrost region hold about 1,035 ± 150 billion tonnes of carbon in the top three metres, with a further 91 ± 52 billion tonnes in river deltas and 181 ± 54 in the Yedoma deposits below that depth (Hugelius et al., 2014). The authors note that data gaps remain, particularly for the High Arctic.
Fossil fuels belong to a third category again. Coal, oil and gas are carbon that the slow cycle buried as organic matter over geological time, and the calculations of Phanerozoic carbon fluxes are in effect an account of how that burial happened (Berner, 2003). Treating them as part of the living cycle is the error that makes the present situation look routine.
The ocean
Part of the ocean's capacity is chemical and part is biological. Carbon dioxide dissolves and reacts in sea water, and separately, plankton fix carbon in the sunlit surface and some of it sinks before it is respired. Marine producers account for roughly half of global net primary production even though marine life itself holds little carbon at any moment (Field et al., 1998; Bar-On et al., 2018).
The ocean is the largest mobile store, and its uptake has been measured over decades. Gruber and colleagues compared repeat hydrographic surveys from 1994 and 2007 and found that the ocean's inventory of human-derived carbon had grown by 34 ± 4 billion tonnes over that period, an average of 2.6 ± 0.3 billion tonnes a year, or 31 ± 4% of global emissions (Gruber et al., 2019).
That global figure hides large regional differences in storage rate, which the authors attribute to climate-driven changes in ocean circulation rather than to changes in chemistry (Gruber et al., 2019). Coastal systems illustrate the same point at a smaller scale, as the long record at Waituna Lagoon shows.
The atmosphere, by contrast, holds far less carbon than the ocean or the soils, and that is precisely why it responds so sharply. A flow that looks modest beside the exchange between plants and air is large beside the amount of carbon the air actually holds, so additions accumulate there before they are redistributed to the slower stores.
How human activity has changed the flows
The assessment of why atmospheric carbon dioxide is rising is not in dispute. The IPCC states that it is unequivocal that the increases in carbon dioxide, methane and nitrous oxide since the pre-industrial period are caused by human activities (IPCC, 2021).
The size of the addition is tracked annually. In 2023, fossil fuel use released 10.1 ± 0.5 billion tonnes of carbon and land-use change a further 1.0 ± 0.7, giving 11.1 ± 0.9 billion tonnes in total, or 40.6 ± 3.2 billion tonnes of carbon dioxide (Friedlingstein et al., 2025).
Component of the 2023 budget | Billion tonnes of carbon per year |
Fossil fuel emissions | 10.1 ± 0.5 |
Land-use change emissions | 1.0 ± 0.7 |
Total anthropogenic emissions | 11.1 ± 0.9 |
Added to the atmosphere | 5.9 ± 0.2 |
Taken up by the ocean | 2.9 ± 0.4 |
Taken up by land | 2.3 ± 1.0 |
Budget imbalance | minus 0.02 |
Note: these are annual flows for a single year, not the sizes of the reservoirs, and the uncertainty ranges are part of the result rather than decoration (Friedlingstein et al., 2025). The imbalance line is what remains after the other five are estimated independently.
Roughly half of what is emitted each year stays in the air, and the rest is taken up by land and ocean. Measured directly, the global average concentration of carbon dioxide rose from 419.35 parts per million in 2023 to 425.62 in 2025 (NOAA, 2026), having stood near 278 before industrialisation (Friedlingstein et al., 2025). The figure for the most recent year is provisional and is revised as more records come in (NOAA, 2026).
Land-use change is the smaller of the two emission terms but the harder one to pin down. Clearing, draining and replanting move carbon between vegetation, soil and air at the same time, and the result has to be reconstructed from land-use records rather than read off an instrument, which is why its uncertainty range is wide relative to its size (Friedlingstein et al., 2025).
The share of each year's emissions that stays in the air is not fixed either. It depends on how vigorously land and ocean respond, and both responses vary with weather, circulation and the state of vegetation. That is the main reason the annual atmospheric growth rate jumps around even when emissions themselves change little (Friedlingstein et al., 2025).
Discussions of what to do about this usually move quickly to growth and consumption, and the argument there is older than the measurements. The debate traced in the limits to growth literature turns on the same accounting problem: a flow that is small next to natural exchanges can still accumulate.
The five components of that budget are not measured the same way, which is worth knowing before comparing them. Fossil emissions come from energy statistics and cement production data, land-use emissions from bookkeeping models, the atmospheric growth rate from direct measurement, and the ocean and land sinks from models constrained by observations (Friedlingstein et al., 2025).
The word sink is also easy to misread. It describes a measured net transfer in a particular period, not a permanent store or a guaranteed service, and the same water or soil can release carbon again when conditions change. Permafrost soils hold about 1,035 billion tonnes of carbon in the upper three metres, and whether that stays put is a separate question from how much is there (Hugelius et al., 2014).
What is proven about the carbon cycle, and what remains uncertain?
Four things are settled: the cause of the increase, the approximate size of the annual emissions, the measured share taken up by the ocean, and the concentration left in the air. The cause is not in question (IPCC, 2021), the ocean took up 31 ± 4% of emissions between 1994 and 2007 (Gruber et al., 2019), and the concentration is measured directly rather than modelled (NOAA, 2026).
The direction of the human addition is settled. What is still argued over is how the surplus is divided between land and ocean, and how long each will keep taking it.
The open questions are named by the people who compile the budget. They report a persistent large uncertainty in land-use change emissions, low agreement between methods on the land carbon flux in the northern extra-tropics, and a discrepancy between methods on the mean ocean sink (Friedlingstein et al., 2025).
Permafrost is the clearest case of a known store with an unknown release. Current evidence points to a gradual and prolonged release of greenhouse gases as the climate warms, but the magnitude and timing remain uncertain (Schuur et al., 2015). The stock figures and the release figures are separate claims, and only the first is reasonably well constrained.
The ocean estimate has its own open edge. The inventory change between 1994 and 2007 is based on repeat surveys of the same hydrographic sections and a regression method, and the authors note that regional storage rates differ substantially, probably because circulation itself has varied (Gruber et al., 2019). A global average built from uneven regional behaviour is a real number, but it is not the same as a stable rate.
Even the best-measured flow carries a caveat. The estimate of land photosynthesis rests on flux towers and diagnostic models, and process-based biosphere models still vary widely in how they distribute that uptake by latitude (Beer et al., 2010). For a reader, the practical conclusion is that the totals are firmer than the regional detail.
Frequently asked questions
Why is the carbon cycle important?
It sets how much carbon dioxide stays in the air, and therefore how much warming follows a given level of emissions. Land and ocean currently absorb close to half of what is released each year, so the strength of those two sinks decides how fast the atmospheric concentration climbs.
How long does carbon stay in the atmosphere?
There is no single figure, which is why careful sources avoid giving one. Individual molecules swap in and out of plants and surface water within a few years, while the extra carbon added as a whole is drawn down by the slow rock cycle, which works over millions of years (Berner, 2003).
What is the difference between the fast and slow carbon cycle?
The fast cycle is biological and moves carbon between air, life, soil and surface water over seasons to centuries. The slow cycle exchanges carbon between rocks and the surface through weathering, burial and volcanism, and operates over millions of years rather than human lifetimes.
Does the ocean take up more carbon than forests?
Published budgets compare the ocean with the land as a whole rather than with forests alone. In 2023 the ocean absorbed about 2.9 ± 0.4 billion tonnes of carbon and the whole land sink about 2.3 ± 1.0 billion tonnes, so the ranges overlap and the gap is not firmly established (Friedlingstein et al., 2025).
Where is most of Earth's carbon held?
Overwhelmingly in rocks and sediments, which exchange carbon only over geological time. Among the pools that move on human timescales, the ocean holds the most, followed by soils, then the atmosphere, then living plants at roughly 450 billion tonnes of carbon (Bar-On et al., 2018).
Sources
- Friedlingstein P, O'Sullivan M, Jones MW, et al. Global Carbon Budget 2024. Earth System Science Data. 2025;17:965–1039. DOI 10.5194/essd-17-965-2025.
- National Oceanic and Atmospheric Administration (NOAA), Global Monitoring Laboratory. Trends in atmospheric carbon dioxide: global annual means. Boulder, CO. Dataset updated 9 October 2026. https://gml.noaa.gov/ccgg/trends/gl_data.html
- Beer C, Reichstein M, Tomelleri E, et al. Terrestrial gross carbon dioxide uptake: global distribution and covariation with climate. Science. 2010;329(5993):834–838. DOI 10.1126/science.1184984.
- Field CB, Behrenfeld MJ, Randerson JT, Falkowski P. Primary production of the biosphere: integrating terrestrial and oceanic components. Science. 1998;281(5374):237–240. DOI 10.1126/science.281.5374.237.
- Bar-On YM, Phillips R, Milo R. The biomass distribution on Earth. Proceedings of the National Academy of Sciences. 2018;115(25):6506–6511. DOI 10.1073/pnas.1711842115.
- Jackson RB, Lajtha K, Crow SE, Hugelius G, Kramer MG, Pineiro G. The ecology of soil carbon: pools, vulnerabilities, and biotic and abiotic controls. Annual Review of Ecology, Evolution, and Systematics. 2017;48:419–445. DOI 10.1146/annurev-ecolsys-112414-054234.
- Hugelius G, Strauss J, Zubrzycki S, et al. Estimated stocks of circumpolar permafrost carbon with quantified uncertainty ranges and identified data gaps. Biogeosciences. 2014;11:6573–6593. DOI 10.5194/bg-11-6573-2014.
- Gruber N, Clement D, Carter BR, et al. The oceanic sink for anthropogenic CO2 from 1994 to 2007. Science. 2019;363(6432):1193–1199. DOI 10.1126/science.aau5153.
- Berner RA. The long-term carbon cycle, fossil fuels and atmospheric composition. Nature. 2003;426(6964):323–326. DOI 10.1038/nature02131.
- Schuur EAG, McGuire AD, Schadel C, et al. Climate change and the permafrost carbon feedback. Nature. 2015;520(7546):171–179. DOI 10.1038/nature14338.
- Intergovernmental Panel on Climate Change (IPCC). Climate Change 2021: The Physical Science Basis. Contribution of Working Group I to the Sixth Assessment Report, Chapter 5: Global Carbon and Other Biogeochemical Cycles and Feedbacks. Cambridge University Press; 2021.

Maya Hartwell — author
Maya writes environment and plant science explainers, with an editorial focus on biodiversity, ecosystems, water quality, environmental pollution, plant biology, invasive plants, natural materials and the use of biological resources in environmental technologi...
Related
Is Burning Boreal Wood Carbon Neutral? What a 2011 Model Showed
Waituna Lagoon and Sea-Level Rise: What the 2019 Study Found
Global limits to growth and pathways to a sustainable future
Does Cloud Seeding Pay Off for Farmers? North Dakota’s 2019 Sums

Thermal comfort: temperature, humidity, airflow and clothing
The greenhouse effect and the role of methane from livestock
What is biodiversity and why it matters for food and farming