




Waituna Lagoon and Sea-Level Rise: What the 2019 Study Found
A 2019 study projected that 1 m of sea-level rise would cut Waituna Lagoon’s intertidal mudflats by 64% (Tait & Pearce, 2019). That loss applies when the gravel barrier is open to the sea, and the same study expected bigger inflows to push the lagoon to its opening trigger more often (Tait & Pearce, 2019). Openings would then have to come more often or at higher water levels, and would likely get harder as the sea rises (Tait & Pearce, 2019). All of this is projection from existing data and expert judgement, not observation (Tait & Pearce, 2019).
Below, we explain how the assessment was made, what it projected for rain, river inflows, sea level and wildlife, and why the Intergovernmental Panel on Climate Change (IPCC) cited it. We then compare those projections with what has happened since, from emergency openings and a Ruppia collapse to updated sea-level projections. We do not assess farm nutrient rules. The original study is summarised in Cabdirect archive record 20203217703.
What Kind of Place Is Waituna Lagoon?
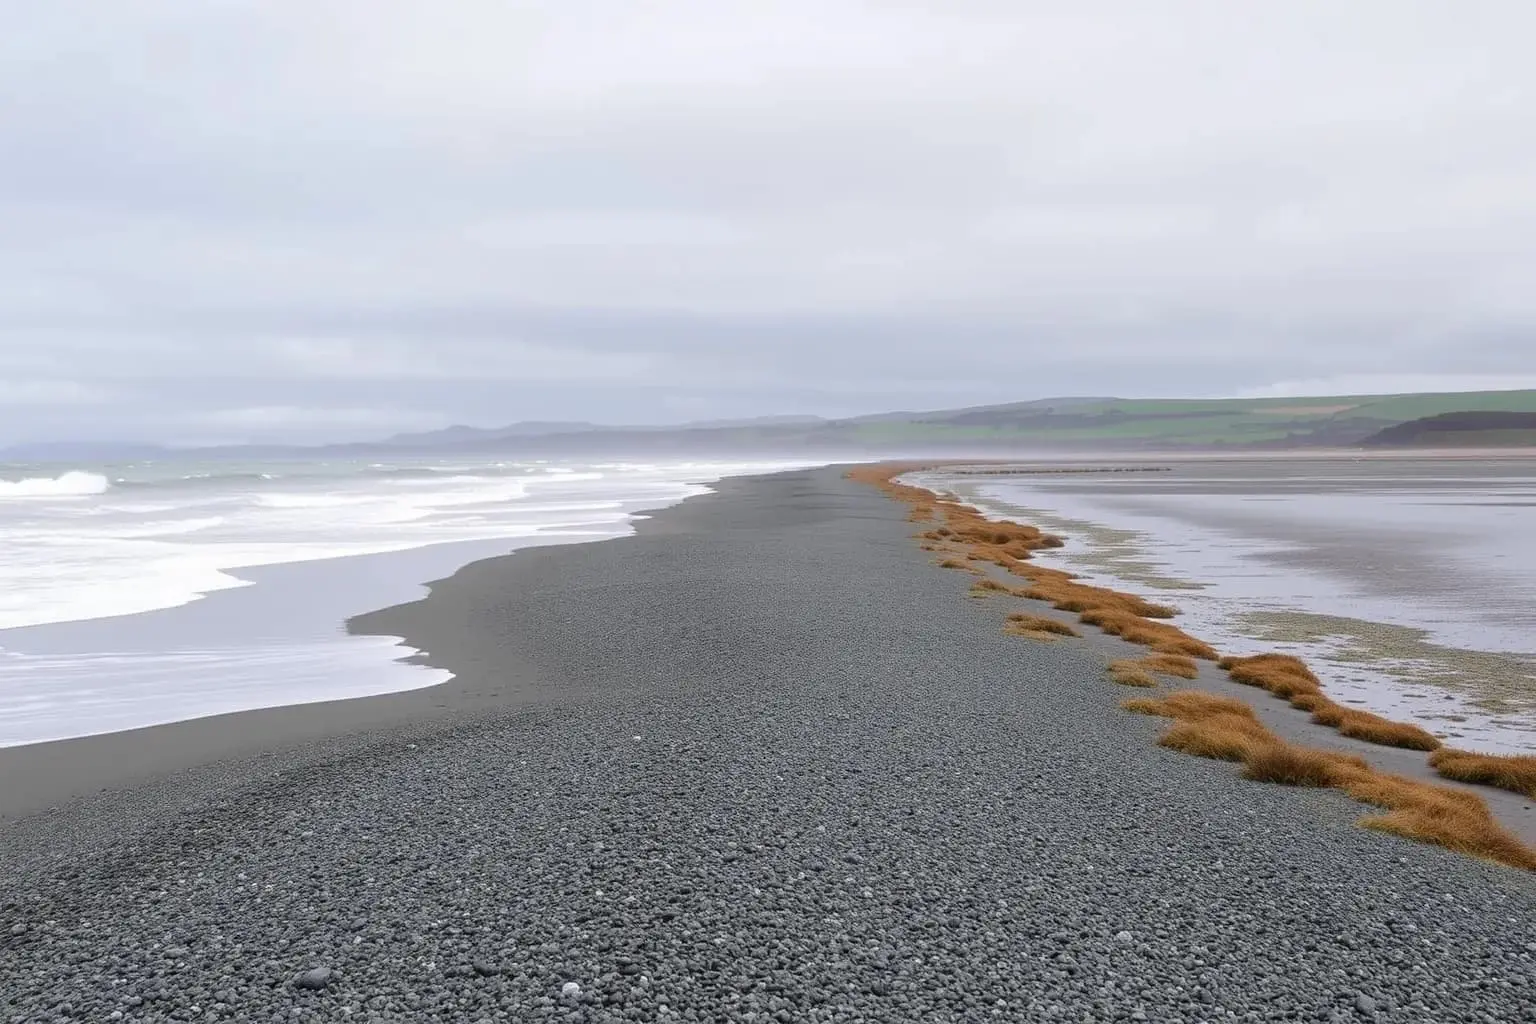
Waituna Lagoon is a shallow freshwater lagoon of about 1,350 ha near Invercargill, cut off from the sea by a gravel barrier on the Southland coast (Tait & Pearce, 2019). It forms part of the Awarua Wetland Ramsar site, which the report gives as 19,500 ha, and the Department of Conservation (DOC) counts it among 2,520 wetlands recognised worldwide as internationally important (Tait & Pearce, 2019; Department of Conservation, 2026). For Ngāi Tahu, the lagoon holds very high cultural significance (Tait & Pearce, 2019).
Lagoons of this kind are fairly rare in New Zealand: coarse gravel barriers let water seep out to the sea, so they stay closed most of the time (Tait & Pearce, 2019). Local authorities have cut through Waituna’s barrier since the early 20th century, from the 1950s mainly to drain surrounding farmland, and after a cut the lagoon turns estuarine until the barrier seals again (Tait & Pearce, 2019).
Farms, Ruppia and wading birds
More than 80 bird species have been recorded in the lagoon and wetland complex, and 18 fish species in the catchment and lagoon (Tait & Pearce, 2019). At the 2025 consent hearing a DOC solicitor put the bird count above 90 species (RNZ, 2025). Waders such as the eastern bar-tailed godwit, which breeds in western Alaska, feed on intertidal mudflats that have shrunk as the barrier built up (Tait & Pearce, 2019). New Zealand’s 2021 bird assessment lists the godwit as At Risk – Declining and the white heron as Nationally Critical (Robertson et al., 2021).
How Was the 2019 Assessment Done?
The report was a desktop assessment built from existing projections, with no new field measurements, by Andrew Tait and Petra Pearce of the National Institute of Water and Atmospheric Research (NIWA) and DOC (Tait & Pearce, 2019). It appeared in November 2019 in DOC’s peer-reviewed Science for Conservation series, written for the groups working on the lagoon (Tait & Pearce, 2019).
Climate figures came from Ministry for the Environment projections in which six global models were downscaled to a 5 km grid and averaged, across emissions scenarios from RCP2.6 (low) to RCP8.5 (high) (Tait & Pearce, 2019). Inflow changes were read from colour-coded maps of median changes in a 2018 NIWA report for Environment Southland, based on a national water model (Tait & Pearce, 2019). Those maps compare 2036–2056 and 2086–2099 with 1986–2005, while the climate figures use 2080–2099 as the end of the century (Tait & Pearce, 2019).
To gauge sea-level effects, the authors mapped the open lagoon at today’s sea level and at six higher ones, 0.2 m to 1.2 m above it, using a LiDAR-based elevation model (Tait & Pearce, 2019). They assumed the tidal range inside an open lagoon stays at about 0.6 m and that the barrier survives at least until 2100, and judged ecological effects from current practice, earlier modelling and expert knowledge (Tait & Pearce, 2019).
What Did the Study Project?
The report projected a warmer Southland that is wetter except in summer, with larger floods all year (Tait & Pearce, 2019). By the end of the century, rainfall over the Waituna catchment was projected to rise by 5–10% under low emissions and 15–20% under high emissions, and Southland’s mean air temperature by about 0.5–2.5°C (Tait & Pearce, 2019). Summers, by contrast, were expected to become drier, with low flows falling late in the century (Tait & Pearce, 2019).
Those changes feed straight into the lagoon. Under high emissions, mean annual discharge was projected to rise by up to 10% by mid-century and by more than 50% by the century’s end, mostly in autumn, winter and spring (Tait & Pearce, 2019). The mean annual flood, the average of each year’s biggest peak flow, was projected to grow by 20–100% under medium and high emissions (Tait & Pearce, 2019). The authors stressed that downscaled rainfall projections, and therefore the flow changes, carry significant uncertainty (Tait & Pearce, 2019).
For the sea, the report noted about 0.2 m of rise around New Zealand over the past century and, citing 2017 national guidance, a further 0.2–0.3 m by 2040 and 0.4–0.9 m by 2090 (Tait & Pearce, 2019). Under medium-to-high emissions it placed a 1.0 m rise in 2110–2130, adding that faster ice melt could bring the dates much earlier (Tait & Pearce, 2019).
Shrinking mudflats
The central mapping result concerns the intertidal zone, the mudflats exposed between low and high tide while the barrier is open (Tait & Pearce, 2019). As the sea rises, the low-tide area grows more than the high-tide area, so the band between them narrows from around 700 ha to roughly 400–230 ha, shrinking even at 0.2 m (Tait & Pearce, 2019). At 1 m of rise the high-tide area would grow by 30% and the low-tide area by 134%, leaving 64% less mudflat (Tait & Pearce, 2019). The authors judged that this would considerably affect the lagoon’s wading birds (Tait & Pearce, 2019).
What Would the Changes Mean for the Lagoon?
Bigger inflows would mean opening the lagoon more often, or letting it rise higher and flood more land before each opening, the report concluded (Tait & Pearce, 2019). Under the consent then in force, as the report summarised it, the barrier could be cut at 2.0 m on the Waghorns Road bridge gauge in winter and 2.2 m in other seasons (Tait & Pearce, 2019). That gave roughly one opening a year (Tait & Pearce, 2019). With higher inflows those levels would likely be reached more often (Tait & Pearce, 2019).
A rising sea would also blunt each opening: with the sea closer to the lagoon’s level, there would be less force to scour a channel and flush out sediment and nutrients (Tait & Pearce, 2019). The authors suggested that by about 2150 high tide might sit not far below today’s opening threshold, and proposed a buffer of retired farmland next to the lagoon (Tait & Pearce, 2019).
Ecological risks
This is the part of the report the IPCC picked up. Its 2022 Australasia chapter cites Tait and Pearce for the statement that sea-level rise “will shrink the intertidal zone”, with implications for wading birds (Lawrence et al., 2022). It also lists them among five sources for the degradation and loss of freshwater wetlands (Lawrence et al., 2022). The report was more cautious in its abstract, calling the shrinkage likely and saying it may affect wading birds, and its figures apply to one lagoon while open to the sea (Tait & Pearce, 2019).
A lagoon held shut by gravel and opened by bulldozer depends on rules written for today’s rainfall and today’s sea.
What Has Happened at Waituna Since 2019?
Since 2019 the lagoon has gone through long closures, emergency openings and sharp swings in its plant life (de Winton et al., 2025). The last opening under the old consent came in early September 2021, and the gap closed quickly (de Winton et al., 2023). That permit expired in early 2022, an application to renew it was withdrawn, and the lagoon was not opened again until January 2024 (de Winton et al., 2025; de Winton et al., 2023).
The January 2024 cut was made for water quality rather than drainage. Environment Southland opened the barrier at a moderate 1.46 m above sea level to disrupt a toxic cyanobacterial bloom, which had produced a record chlorophyll-a reading of 0.316 mg/L (de Winton et al., 2025). NIWA reports that the cut was made under emergency works powers and that the lagoon stayed open for about two months (de Winton et al., 2025). A second emergency opening in September 2024 followed 31 days above 2.3 m, and the lagoon was still open 117 days later (de Winton et al., 2025).
Ruppia’s collapse and recovery
Ruppia peaked in 2023, when 85% of samples held reproductive plants after the lagoon had stayed closed through two growing seasons (de Winton et al., 2025). After the 2024 openings it collapsed: average cover in 2025 was 2% against a target of 30%, and no reproductive plants were found in 2024 or 2025 (de Winton et al., 2025). Macroalgal cover of 15% exceeded the recommended limit (de Winton et al., 2025). From 17 years of monitoring, NIWA concluded that artificial openings reaching into Ruppia’s spring-to-summer growing season are undesirable (de Winton et al., 2025).
Land around the lagoon
Some low-lying farmland around the lagoon has already changed hands. After flood-risk research, Whakamana te Waituna and its partners bought 584 ha of farmland around the lagoon in 2021, and 403 ha was vested in Te Wai Parera Trust of Awarua Rūnanga (Living Water, n.d.).
How Well Do the 2019 Projections Hold Up?
The report’s sea-level timing under higher emissions still fits newer national guidance (Tait & Pearce, 2019; Ministry for the Environment, 2024), while its flow and mudflat figures remain untested. It added no field data, read flow changes off regional maps, and its mapping assumes a fixed tidal range, a barrier that survives to 2100 and no change in land height; one entry in its area table is internally inconsistent (Tait & Pearce, 2019).
The guidance also brings in vertical land movement, which the report left out (Tait & Pearce, 2019; Ministry for the Environment, 2024). At the NZ SeaRise coastal site closest to the lagoon, satellite-derived data suggest slight sinking of about 1 mm a year, too uncertain to tell apart from zero (Hamling et al., 2024). Including it, relative rise there by 2100 is projected at 0.90 m under the median SSP5-8.5 projection and 0.64 m under SSP2-4.5, relative to 1995–2014 (Hamling et al., 2024).
Newer climate projections are harder to compare. A 2025 study that downscaled six newer (CMIP6) models under SSP3-7.0 projected 3.1°C of national mean warming by the century’s end, against the report’s Southland figure of up to 2.5°C under RCP8.5 (Tait & Pearce, 2019; Gibson et al., 2025). The scenarios and areas differ, and the study gave no Southland rainfall change, so the report’s inflow projections cannot yet be checked against newer models (Gibson et al., 2025).
Frequently asked questions
Why is Waituna Lagoon opened to the sea?
The barrier has been cut since the early 20th century, from the 1950s mainly to drain low-lying farmland, and openings also flush out nutrient-rich water (Tait & Pearce, 2019). In 2024 Environment Southland made two emergency openings, first to break up a toxic algal bloom and later after weeks of high water (de Winton et al., 2025).
How much mudflat could Waituna Lagoon lose as the sea rises?
The 2019 report projected the intertidal area shrinking from around 700 ha to about 400–230 ha, depending on how far the sea rises, 64% less with a 1 m rise (Tait & Pearce, 2019). The figures apply only while the lagoon is open to the sea, and one inconsistent table entry leaves the exact figure uncertain (Tait & Pearce, 2019).
When could the sea near Waituna rise by 1 m?
The 2019 report dated a 1.0 m rise to 2110–2130 under medium-to-high emissions (Tait & Pearce, 2019). National guidance from 2024 gives 2115–2155 across very-high to moderate emissions (Ministry for the Environment, 2024), and near the lagoon, including land movement, the median SSP5-8.5 path reaches 0.90 m by 2100 (Hamling et al., 2024).
What did the 2025 consent for opening Waituna Lagoon allow?
Media reported that independent commissioners granted a 20-year consent in October 2025, with opening triggers rising from 2.3–2.4 m in the first decade to 2.5 m from year 15 (Southland Tribune, 2025). Federated Farmers appealed (Federated Farmers, 2025), and mediation was scheduled for 30 July 2026 (Southland Conservation Board, 2026).
Which threatened and at-risk birds use Waituna Lagoon?
The 2019 report lists the New Zealand dotterel, white heron, black-fronted tern, banded dotterel and white-fronted tern as recorded in the lagoon area, along with migratory waders such as the eastern bar-tailed godwit (Tait & Pearce, 2019). In the 2021 national assessment the black-fronted tern is Nationally Endangered and the banded dotterel At Risk – Declining (Robertson et al., 2021).
Sources
- Tait, A., & Pearce, P. (2019). Impacts and implications of climate change on Waituna Lagoon, Southland. Science for Conservation 335. Department of Conservation, Wellington. – Cabdirect archive record 20203217703
- Lawrence, J., Mackey, B., Chiew, F., Costello, M. J., Hennessy, K., Lansbury, N., Nidumolu, U. B., Pecl, G., Rickards, L., Tapper, N., Woodward, A., & Wreford, A. (2022). Australasia. In Climate Change 2022: Impacts, Adaptation and Vulnerability. Contribution of Working Group II to the Sixth Assessment Report of the Intergovernmental Panel on Climate Change (pp. 1581–1688). Cambridge University Press.
- de Winton, M., Zabarte-Maeztu, I., & Taumoepeau, A. (2025). Technical Report on Vegetation Status in Waituna Lagoon: 2009–2025. NIWA report for the Department of Conservation.
- de Winton, M., Zabarte-Maeztu, I., & Taumoepeau, A. (2023). Technical Report on Vegetation Status in Waituna Lagoon: 2009–2023. NIWA report for the Department of Conservation.
- Southland Tribune. (2025, October 14). Farmers ‘bitterly disappointed’ by Waituna Lagoon ruling.
- RNZ. (2025, July 29). Southland lagoon at risk of ecological tipping point, warns DOC.
- Federated Farmers. (2025, November 27). Feds appeal lagoon decision. Farmers Weekly.
- Southland Conservation Board. (2026). Public board papers, 2 September 2026. Department of Conservation.
- Department of Conservation. (2026, February 2). Waituna Lagoon in better health for World Wetlands Day [Media release].
- Ministry for the Environment. (2024). Coastal hazards and climate change guidance (ME 1805). Ministry for the Environment, Wellington.
- Hamling, I., Naish, T., Levy, R., Hreinsdottir, S., Bengtson, S., Praveen, K., Kopp, B., & Garner, G. (2024). New Zealand Vertical land movement and sea rise projections [Data set]. Zenodo.
- Gibson, P. B., Broadbent, A. M., Stuart, S. J., Lewis, H., Campbell, I., Rampal, N., Harrington, L. J., & Williams, J. (2025). Downscaled CMIP6 future climate projections for New Zealand: climatology and extremes. Weather and Climate Extremes, 49, 100784.
- Living Water. (n.d.). Whakamana Te Waituna partnership – Phase 1. Fonterra and Department of Conservation.
- Robertson, H. A., Baird, K. A., Elliott, G. P., Hitchmough, R. A., McArthur, N. J., Makan, T. D., Miskelly, C. M., O’Donnell, C. F. J., Sagar, P. M., Scofield, R. P., Taylor, G. A., & Michel, P. (2021). Conservation status of birds in Aotearoa New Zealand, 2021. New Zealand Threat Classification Series 36. Department of Conservation.

Maya Ellison — author
Maya Ellison is an environmental science writer for Cabdirect's Environment & Climate section. She holds an MSc in Environmental Science and a BSc in Geography. Her coverage includes climate change, biodiversity, conservation, pollution, land use, sustainable...
Related
Luffa cylindrica fibres for contaminant removal research
How external resistance shapes azo dye removal in microbial fuel cells
Water planning for sustainable growth in constrained catchments

Does Cloud Seeding Pay Off for Farmers? North Dakota’s 2019 Sums

How consumerism affects the pursuit of sustainable tourism
Acacia Invasion and Cork Oaks in Algeria: Evidence from El Kala