






Gluconeogenesis From Glycine and Serine in the Rat
G. B. Nadkarni, B. Friedmann and S. Weinhouse used carbon-14-labelled amino acids to investigate gluconeogenesis from glycine and serine in rats. Their 1960 study followed labelled carbon into blood sugar, liver glycogen, skeletal-muscle glycogen and respired carbon dioxide under different fasting and glucose-feeding conditions.The experiments also compared D-serine with L-serine. The reported differences in incorporation and carbon randomization led the authors to suggest distinct metabolic routes, with L-serine passing through pyruvate and D-serine through hydroxypyruvate.
How the Rat Tracer Experiments Were Designed
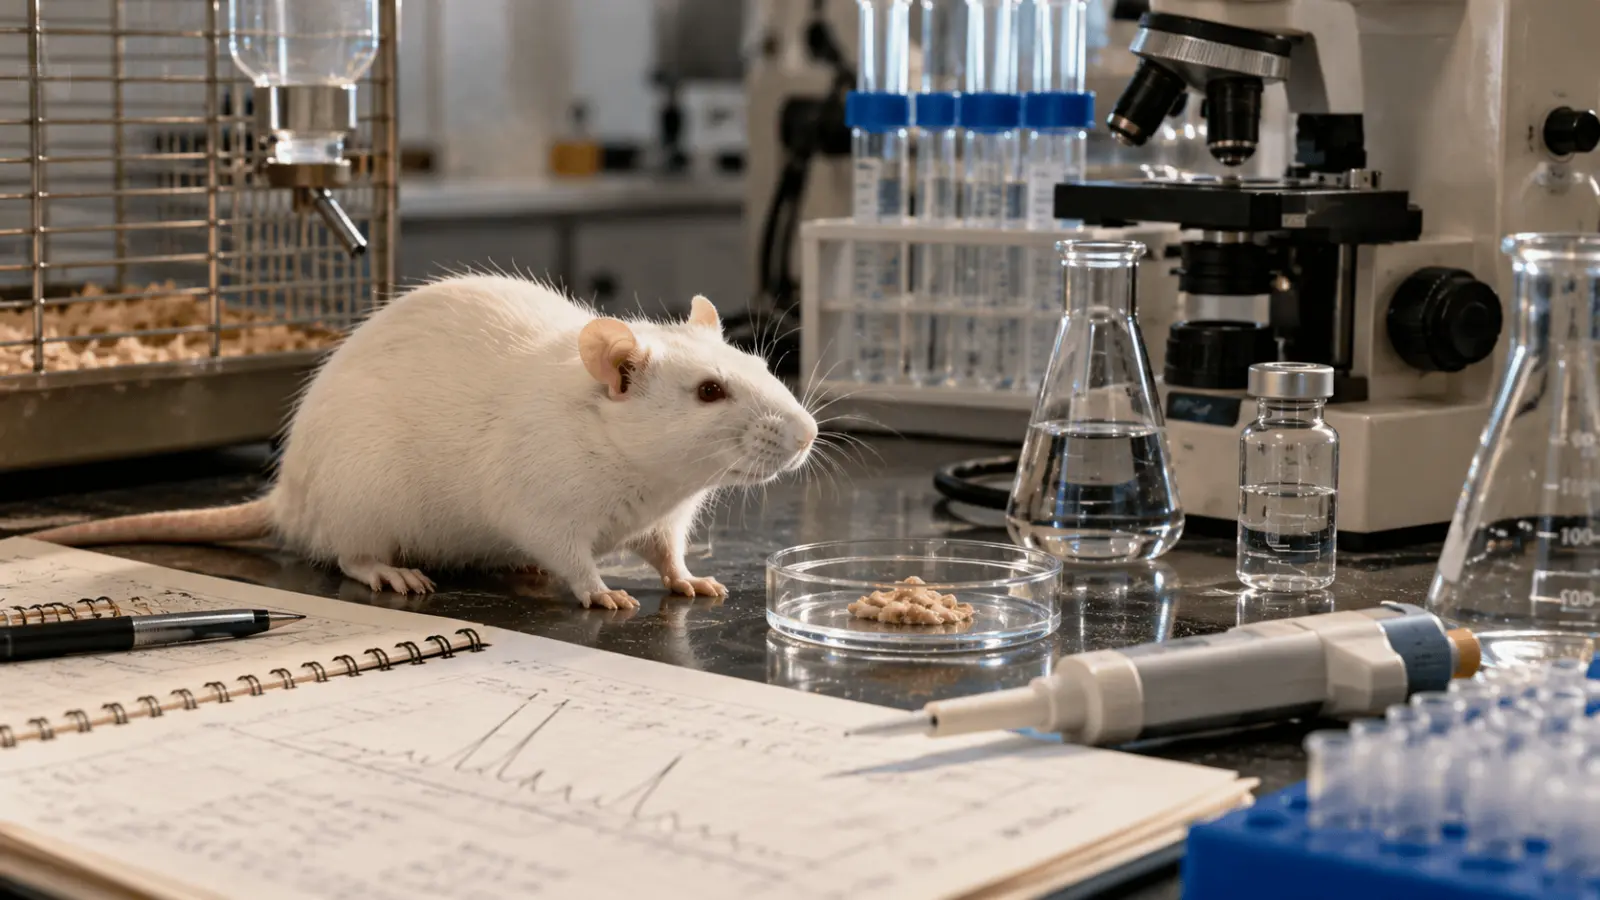
In the 1960 experiment, investigators studied rats weighing approximately 200 g after a 24-hour fasting period. Researchers used carbon-14-labelled glycine and serine to trace how these amino acids contributed to glucose production. By tracking the distribution of radioactive carbon, they examined the metabolic pathways involved in gluconeogenesis and identified how carbon from these amino acids was incorporated into other compounds.
Some rats received 5 m-moles of glucose in 3 ml of water by stomach tube at the same time as the labelled amino acid. A separate experimental arrangement involved fasted rats that had received the same glucose amount four hours before amino-acid injection. These animals were placed in a metabolism chamber so that respired carbon dioxide could be collected.
Blood, Liver, Muscle and Respired Carbon Dioxide Were Examined
Rats were killed at different times after injection of the labelled amino acid. Blood, liver and skeletal muscle were then examined, allowing the researchers to compare incorporation of labelled carbon into blood sugar and tissue glycogen. The metabolism-chamber experiments added another destination for the tracer: carbon dioxide produced through oxidation.
The number of animals in each experimental group and the complete sampling schedule were not reported. The experiments distinguished three metabolic conditions: fasting, glucose administration at the time of tracer injection and glucose administration four hours before injection.
A tracer experiment is designed to identify the destinations of labelled atoms, rather than to measure the entire flow of a nutrient through every reaction. Carbon recovered in blood sugar demonstrates that labelled amino-acid carbon reached that product, but the observation alone does not reveal all intervening reactions. The glucose-feeding comparisons are therefore especially informative as changes in where the tracer was recovered. They cannot independently establish how much unlabelled glucose was produced, how quickly every intermediate turned over or whether a single enzyme controlled the change. These distinctions keep the interpretation tied to the endpoints that were actually examined.
Table 1. Experimental Conditions Used in the Rat Tracer Study
Feature | Reported condition |
Animal model | Rats weighing about 200 g |
Fasting period | 24 hours |
Tracer | Labelled glycine, D-serine or L-serine |
Tracer dose | 1–20 mg containing 1–2 µC 14C |
Tracer route | Intraperitoneal injection |
Glucose treatment | 5 m-moles in 3 ml water by stomach tube |
Materials examined | Blood, liver, skeletal muscle and, in specified tests, respired CO2 |
Table note: Group sizes and the complete sampling schedule were not specified.
What Glycine and Serine Contributed to Blood Sugar
In fasted rats, considerable carbon-14 from D-serine, L-serine or glycine appeared in blood sugar. A similar finding was reported in rats that had received glucose four hours earlier. These observations directly support the study's focus on gluconeogenesis because labelled carbon originating in the administered amino acids was recovered in circulating sugar.
Exact percentages of administered tracer recovered in blood sugar were not reported for individual amino acids. All three labelled substrates showed considerable incorporation into blood sugar under fasting conditions and when glucose had been administered four hours earlier.
Blood sugar and tissue glycogen are related carbohydrate pools, but they answer different questions in an isotope study. Label in circulating sugar indicates appearance in the measured blood-sugar fraction; label in glycogen indicates incorporation into a stored carbohydrate fraction. A change in their relative labelling does not necessarily mean that one pool increased by exactly the amount the other decreased. Such a conclusion would require complete quantitative recovery and additional measurements. The 1960 findings instead establish a directional comparison: glucose given with the tracer was associated with less label in blood sugar and more label in glycogen than the relevant fasting condition.
Simultaneous Glucose Administration Reduced Label in Blood Sugar
When glucose was administered at the same time as the labelled amino acid, less carbon-14 appeared in blood sugar, while greater incorporation was observed in liver and muscle glycogen. This redistribution indicates that simultaneous glucose administration altered the metabolic destinations of amino-acid-derived carbon. However, the experiments did not establish which specific regulatory mechanisms were responsible for these changes.
How Glucose Feeding Changed Liver and Muscle Glycogen Labelling
Liver glycogen showed little incorporation of labelled carbon in fasted rats. During fasting, incorporation of labelled carbon into liver glycogen was negligible, even though substantial amounts of amino-acid-derived carbon appeared in circulating blood sugar. The pattern changed when glucose was given at the same time as the amino acid. Under this condition, a significant amount of carbon-14 appeared in liver glycogen. The contrast shows that simultaneous glucose feeding changed where labelled amino-acid carbon was recovered.
Muscle Glycogen Also Received More Label With Simultaneous Glucose
The effect was not restricted to the liver. Far more carbon-14 appeared in muscle glycogen after simultaneous glucose administration than in fasted animals. Thus, simultaneous glucose administration increased the incorporation of amino-acid-derived carbon into glycogen in both the liver and skeletal muscle compared with fasting conditions.
Absolute glycogen concentrations and exact tracer incorporation values were not reported. The results showed negligible incorporation into liver glycogen during fasting and substantially greater glycogen labelling when glucose was administered simultaneously with the amino acid.
Table 2. Reported Effect of Metabolic Condition on Label Distribution
Condition | Blood sugar | Liver glycogen | Muscle glycogen |
Fasted rats | Considerable incorporation | Negligible incorporation | Lower than with simultaneous glucose |
Glucose 4 h before amino acid | Considerable incorporation | Not reported | Not reported |
Glucose at same time as amino acid | Less 14C appeared | Significant amount appeared | Far more 14C than in fasted animals |
Table note: Results are presented as qualitative comparisons because exact tracer incorporation percentages were not reported.
How Much Labelled Serine and Glycine Was Oxidized to Carbon Dioxide
The investigators also followed labelled carbon into respired carbon dioxide. Some carbon-14 from serine was oxidized to carbon dioxide, whereas much less labelled carbon from glycine followed this route in the 1960 experiments. This distinction is important because appearance in carbon dioxide represents a different fate from incorporation into blood sugar or glycogen. The experiment therefore compared not only gluconeogenic incorporation but also oxidation of the labelled amino-acid carbon.
Fasting Had Little Effect on the Reported Oxidation Amount
The amount of serine- or glycine-derived carbon oxidized to carbon dioxide was reported to be little affected by fasting. This observation contrasts with the pronounced differences in glycogen labelling associated with glucose administration. Exact carbon-dioxide recovery percentages and detailed oxidation time curves were not reported. Nevertheless, the experiments showed that a greater proportion of serine-derived carbon than glycine-derived carbon was oxidized to carbon dioxide, while fasting had relatively little influence on the amount oxidized.
Carbon dioxide recovery offers a complementary perspective because labelled carbon can leave the measured carbohydrate pools through oxidation. The relative amounts reported for serine and glycine help distinguish their observed fates in this experiment, but the carbon dioxide measurement cannot by itself reconstruct the complete metabolic pathway. Similar oxidation of D-serine and L-serine also does not imply that every earlier reaction was identical. Different routes may ultimately contribute labelled carbon to the same final product. For that reason, the authors interpreted oxidation alongside the carbohydrate incorporation and carbon-position results rather than relying on carbon dioxide recovery alone.
Why D-Serine and L-Serine Behaved Differently
A major comparison in the study concerned the two forms of serine. D-serine was more readily incorporated into blood sugar than L-serine. It was also more readily incorporated into both liver and muscle glycogen. Despite these differences in incorporation into carbohydrate pools, D-serine and L-serine were oxidized to carbon dioxide at similar rates. The study therefore reports a divergence between their relative contribution to sugar and glycogen and their oxidation to carbon dioxide.
The Two Serine Forms Showed Similar Oxidation but Different Incorporation
This combination of findings gave the investigators a basis for considering whether D-serine and L-serine entered carbohydrate metabolism through different routes. Oxidation rates alone did not distinguish the metabolic routes of D-serine and L-serine because both forms produced carbon dioxide at similar rates. Instead, the stronger incorporation of D-serine into blood sugar and glycogen, together with the carbon-randomization evidence, contributed to the authors' metabolic interpretation.
Table 3. D-Serine and L-Serine Comparisons Reported by the Study
Outcome | D-serine relative to L-serine |
Blood sugar incorporation | More readily incorporated |
Liver glycogen incorporation | More readily incorporated |
Muscle glycogen incorporation | More readily incorporated |
Oxidation to CO2 | Similar rates |
Carbon randomization in glycogen | Less randomization than L-serine |
Proposed route | Hydroxypyruvate; L-serine proposed to proceed through pyruvate |
Table note: The pyruvate/hydroxypyruvate distinction is the authors' proposed interpretation of the tracer evidence.
What Carbon Randomization Revealed in Liver Glycogen
The investigators degraded liver glycogen to examine the distribution of labelled carbon within the glucose units of glycogen. When this glycogen was degraded, carbon-14 derived from L-serine showed much more randomization than carbon-14 derived from D-serine.
Differences in carbon randomization were observed at positions 1, 2, 5 and 6 of glycogen-derived glucose. This positional information gave the study a more detailed metabolic dimension than simply measuring total radioactivity in glycogen.
L-Serine Produced More Randomization Than D-Serine
Greater randomization means that the labelled carbon from L-serine was distributed among the specified glucose carbon positions to a greater extent than label derived from D-serine. This difference in carbon distribution provided evidence that D-serine and L-serine followed distinct metabolic routes. Complete numerical measurements for individual glucose carbon positions were not reported. Carbon randomization among positions 1, 2, 5 and 6 of glycogen-derived glucose was substantially greater following L-serine administration than D-serine administration.
Positional labelling can carry information that a single total-radioactivity measurement cannot provide. Two glycogen samples might contain labelled carbon while differing in which glucose carbon atoms bear that label. The comparison of carbon positions was therefore central to the proposed distinction between serine forms. Nevertheless, randomization is an indirect metabolic signature: its interpretation depends on the pathways and exchange reactions considered by the investigators. The reported contrast supports a hypothesis about route differences, but it is not a direct observation of pyruvate or hydroxypyruvate carrying each labelled atom through every reaction.
Why the Authors Proposed Pyruvate and Hydroxypyruvate Pathways
Based on the tracer patterns, the authors suggested that L-serine is metabolized through pyruvate whereas D-serine is metabolized through hydroxypyruvate. The proposed distinction was based on differences in carbon incorporation and randomization observed during the tracer experiments.
The distinction provides a proposed explanation for the different randomization patterns and the stronger incorporation of D-serine into blood sugar and glycogen. The proposed pathways were inferred from isotope-distribution patterns rather than established through direct measurements of individual enzymatic reactions.
The Pathway Interpretation Came From Isotope Distribution Patterns
The experiment's value lies in tracing labelled carbon through several metabolic destinations and then examining its positional distribution in glycogen-derived glucose. Differences between D- and L-serine therefore supplied evidence from more than one measured endpoint.
Direct enzyme activity measurements and detailed characterization of every metabolic step between serine and glucose were not reported. The authors proposed that L-serine entered glucose metabolism through pyruvate, whereas D-serine followed a pathway involving hydroxypyruvate.
What the 1960 Study Establishes and What It Does Not
The study demonstrates that carbon from glycine and both D- and L-serine can appear in blood sugar in the rat under the experimental conditions described. It also shows that glucose administration can alter the distribution of labelled carbon between circulating sugar and glycogen stores. The results further distinguish the two serine forms: D-serine was incorporated more readily into blood sugar and glycogen, while both forms were oxidized to carbon dioxide at similar rates. Carbon randomization in liver glycogen was greater after L-serine.
The Findings Are Experimental Tracer Evidence From Rats
These conclusions come from rats weighing about 200 g after a 24-hour fast and from tracer doses delivered by intraperitoneal injection. They should therefore be understood as experimental metabolic findings in this animal model rather than direct evidence about human nutrition or clinical metabolism.
Group sizes, complete numerical tracer recoveries, detailed time-course measurements and direct enzyme activity data were not reported. These limitations restrict quantitative interpretation and mechanistic conclusions, although the experiments demonstrated clear differences in carbon distribution among glycine, D-serine and L-serine under fasting and glucose-feeding conditions.
The work is best read as a historical demonstration of how isotope tracing can connect a starting substrate with several metabolic products. It combined measurements from blood, tissues and expired gas with a more detailed analysis of labelled carbon positions. This breadth made the comparisons between glycine, D-serine and L-serine informative, even without a full modern kinetic analysis. The conclusions should remain limited to the reported rat preparations and treatments. Neither the tracer doses nor the fasting and glucose-administration procedures constitute advice about human diet, animal care or medical treatment.
Practical takeaway: Nadkarni, Friedmann and Weinhouse used carbon-14 tracers to investigate how glycine and both forms of serine contributed carbon to blood sugar in rats. Simultaneous glucose administration reduced the appearance of labelled carbon in circulating sugar while increasing its incorporation into liver and muscle glycogen. D-serine was incorporated into blood sugar and glycogen more readily than L-serine, although the two forms were oxidized to carbon dioxide at similar rates. Greater carbon randomization from L-serine in glycogen-derived glucose led the authors to propose metabolism through pyruvate for L-serine and through hydroxypyruvate for D-serine. These conclusions reflect experimental tracer findings in rats rather than direct evidence about human metabolism.
Frequently asked questions
How do scientists study gluconeogenesis using rats?
Nadkarni, Friedmann and Weinhouse used rats weighing approximately 200 g to investigate how labelled amino-acid carbon entered glucose and other metabolic products. In their 1960 experiments, animals underwent a 24-hour fast before receiving carbon-14-labelled glycine or serine. The investigators subsequently examined blood sugar, tissue glycogen and, in selected experiments, respired carbon dioxide.
Can glycine and serine be converted into glucose?
Yes. In the 1960 rat experiments, carbon-14 originating from glycine, D-serine and L-serine was recovered in blood sugar, providing evidence that these amino acids contributed carbon to glucose. Incorporation was substantial under fasting conditions and after glucose administration four hours earlier. The study did not establish corresponding rates in humans.
How does glucose availability affect gluconeogenesis and glycogen storage?
In the rat tracer experiments, giving glucose at the same time as labelled glycine or serine reduced the amount of amino-acid-derived carbon appearing in blood sugar. More label appeared in liver and muscle glycogen instead. These observations describe changes in tracer distribution under experimental conditions, not a general dietary prescription or direct evidence from human studies.
What is the metabolic difference between D-serine and L-serine?
In Nadkarni and colleagues’ rat experiments, D-serine contributed labelled carbon to blood sugar and glycogen more readily than L-serine, although both forms produced carbon dioxide at similar rates. L-serine also produced greater carbon randomization in glycogen-derived glucose. The investigators proposed pathways involving pyruvate for L-serine and hydroxypyruvate for D-serine, based on tracer evidence.
Sources
- Nadkarni, G. B., Friedmann, B., and Weinhouse, S. (1960). Gluconeogenesis from glycine and serine in the rat. Journal of Biological Chemistry, 235(2), 420–425.
- Minthorn, M. L., Jr., Mourkides, G. A., and Koeppe, R. E. (1959). The metabolism of D- and L-serine in the rat. Journal of Biological Chemistry, 234(12), 3205–3209.
- Arnstein, H. R. V. (1951). Some aspects of the metabolism of D- and L-serine by the rat. Biochemical Journal, 49(4), 439–446.
- Sandoval, I. V., and Sols, A. (1974). Gluconeogenesis from serine by the serine-dehydratase-dependent pathway in rat liver. European Journal of Biochemistry, 43(3), 609–616.
- Hetenyi, G., Jr., Anderson, P. J., Raman, M., and Ferrarotto, C. (1988). Gluconeogenesis from glycine and serine in fasted normal and diabetic rats. Biochemical Journal, 253(1), 27–32.
- Nakada, H. I., and Weinhouse, S. (1953). Studies of glycine oxidation in rat tissues. Archives of Biochemistry and Biophysics, 42(2), 257–270.
- Elwyn, D., Ashmore, J., Cahill, G. F., Jr., Zottu, S., Welch, W., and Hastings, A. B. (1957). Serine metabolism in rat liver slices. Journal of Biological Chemistry, 226(2), 735–744.

Adrian Foster — author
Adrian Foster writes with an editorial focus on experimental science, laboratory research, controlled comparisons, measurement techniques and the role of replication in evaluating scientific findings. At CAB Direct, Adrian covers experiments, laboratory method...
Related
The 1989 Molecular Cloning Manual: Why Labs Still Cite It

The Seven Countries Study: Diet and Heart Deaths in 1980

Animals, Fungi and Protozoa: How a 1998 Idea Held Up

Why Homes Get Cheaper Further Out: Alonso’s 1964 Model

Conservation Biology: Ecological Principles and Insularization

Secondary metabolites in tuberculosis: the 2010 review