







Why Homes Get Cheaper Further Out: Alonso’s 1964 Model
Homes get cheaper per square metre further out because buyers trade space against commuting: in Paris, the 2018–21 average was €10,500 within 5 km of the centre and under €4,500 at 10–20 km (Ahrend et al., 2023a). William Alonso set out that trade-off in Location and Land Use (1964): a household on a fixed income chooses both how much land to buy and how far out to live. The book was theory and only outlined how it might be tested (Alonso, 1964; Coblentz, 1966). Later data broadly bear it out, although New York’s average home prices peak in the inner suburbs (Ahrend et al., 2023a). Since 2020, the pandemic has flattened the curve in most US metropolitan areas, especially where home working was common (Gupta et al., 2022).
Below, we explain how Alonso’s model works, why land matters so much for house prices, how prices and dwelling sizes in recent data fit the model and why some cities break the pattern. We then weigh what home working has done to the price curve and what is still unknown. We do not value individual homes or give buying advice. The original study is summarised in Cabdirect archive record 19641802976.
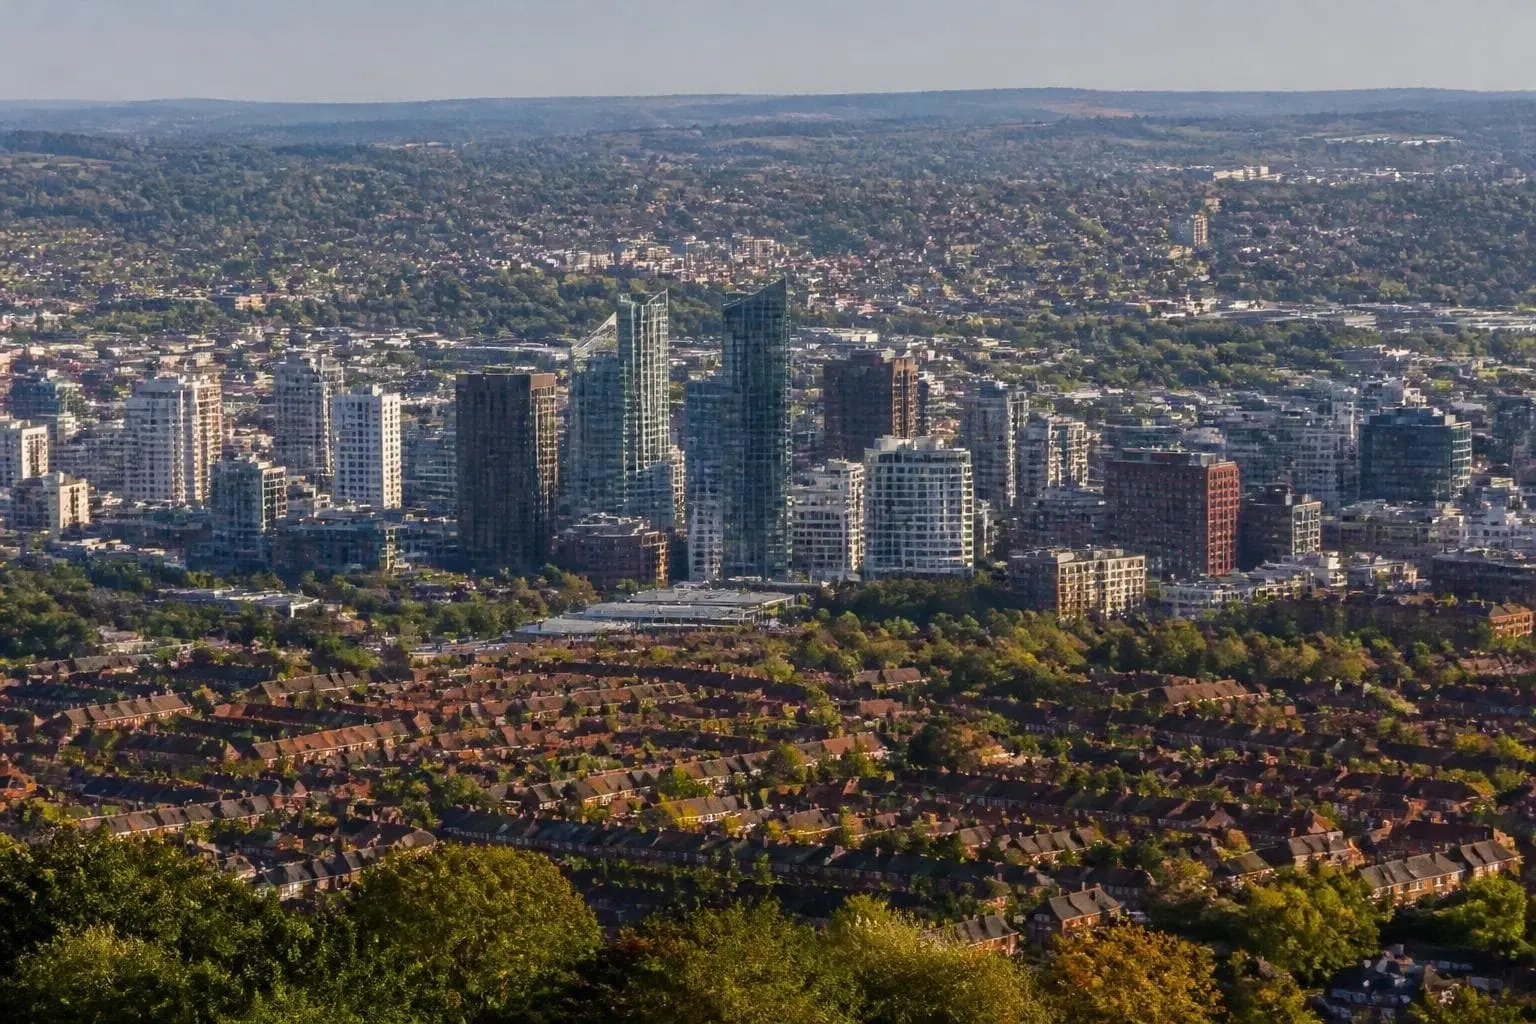
What Did Alonso’s 1964 Book Set Out to Explain?
The book explains how land prices and land uses arrange themselves around a city centre, starting from the choices of households and firms. Harvard University Press published it in 1964 for the Joint Center for Urban Studies of MIT and Harvard. The 204-page monograph grew out of Alonso’s thesis at the University of Pennsylvania (Alonso, 1964; Coblentz, 1966).
A 1966 review in the Natural Resources Journal said Alonso aimed to generalise the classic theory of rent and location and to state it with care. It warned that readers needed a working knowledge of advanced mathematics, but judged the book a valuable addition to land-value theory (Coblentz, 1966).
A post-war puzzle
The review highlighted a puzzle Alonso posed. After the Second World War, American urban land values boomed mostly at the edges of metropolitan areas, while values at the centre rose little or fell, even though population, car ownership and incomes all grew fast (Coblentz, 1966). Decades later, a similar shift of demand towards city edges would be called the doughnut effect (Ahrend et al., 2023a).
The household’s double decision
At the heart of the model is a single household newly arrived in a city. It chooses the size of its plot and its distance from the centre together, dividing a fixed income between land, commuting and all other spending. Alonso took tastes as given, and the reviewer set this “economic man” against human ecologists, for whom schools, neighbours and nearby family also shape where people live (Coblentz, 1966).
Later chapters derive rent functions for farming, bid-price curves for firms and homes, and a market equilibrium that allocates land among them; empirical research is only outlined (Alonso, 1964).
How Does the Trade-Off Between Space and Access Work?
The trade-off works because access to the centre has a price. In the version the OECD summarises, jobs and amenities sit in the central business district and commuting costs rise with distance from it. Land prices fall with distance to compensate for longer commutes, and because land is cheaper, households further out buy more of it, so dwellings get larger (Ahrend et al., 2023a).
A 2007 history of the field by McDonald puts the same idea at the core: households weigh access to a central workplace against what they pay for land or housing. It is often considered the founding act of urban economics (McDonald, 2007). A 2015 handbook review traces modern theory of urban land use to Alonso, Mills and Muth and calls the simplest version a reasonable first-order description of many cities that remains “extremely crude” (Duranton & Puga, 2015).
Price per square metre is not the price of a home
One distinction matters for buyers. The model predicts the price of housing per unit, such as per square metre, not the price of a whole property. Because homes further out are also bigger, the net effect of distance on what a property costs is, in the handbook’s words, “theoretically ambiguous” (Duranton & Puga, 2015). A large suburban house can therefore cost more than a central flat even when each of its square metres is cheaper.
Land, not bricks
Alonso’s subject was land rent, and land has turned out to drive house prices more than buildings do. Across 14 advanced economies, rising land prices rather than construction costs explain about 80% of the global house-price boom since the Second World War (Knoll et al., 2017). In large US metros, land prices rose faster than house prices from 2012 to 2019, raising land’s share of home values (Davis et al., 2021).
Do House Prices Really Fall With Distance From the Centre?
On average they do, but the slope varies widely and some cities break the pattern. The OECD chapter that cites Alonso assembled housing data for 13 countries in Europe and North America, with US figures based on Zillow model estimates rather than recorded sales. Comparing each metropolitan area only with itself, it found prices falling significantly with distance in all three city-size groups, most steeply in metros of 1.5 million people or more (Ahrend et al., 2023a).
Table 1. Average house prices by distance from the centre in selected metros, 2018–2021
Metro | Near the centre | Further out | Shape of the curve |
Paris | €10,500 per m² within 5 km | Under €4,500 per m² at 10–20 km | Steep decline |
Berlin and Vienna | Close to €5,000 per m² within 5 km | About €1,500 per m² at 40–50 km | Decline |
London (flats) | About US$2 million within 5 km | US$500,000 at 20–30 km | Steep decline |
New York (flats) | US$911,000 within 5 km | US$1 million at 5–10 km; US$650,000 at 10–20 km | Inverse U, peak in inner suburbs |
Table note: Averages for 2018 to mid-2021 from one OECD figure (Ahrend et al., 2023a). Euro figures are prices per square metre and US-dollar figures are average prices per home, so the two sets should not be compared.
New York is the clearest exception, at least for prices per home. The chapter reports the same inverse U in San Francisco and many other US metros, where top prices sit in the closer suburbs. Dwelling sizes, by contrast, follow the model neatly in large metros. Among homes sold in 2019 in metros of 1.5 million people or more, average size rose from 84 within 5 km of the centre to 113 at 30–40 km, as Table 2 shows (Ahrend et al., 2023a).
Table 2. Average dwelling size by distance from the centre and metro population, 2019
Metro population | 0–5 km | 5–10 km | 10–20 km | 20–30 km | 30–40 km |
1.5 million or more | 84 | 92 | 107 | 110 | 113 |
250,000 to 1.5 million | 95 | 107 | 112 | 115 | 119 |
50,000 to 250,000 | 98 | 110 | 108 | 98 | 93 |
1.5 million or more, difference from own metro average | −28 | −19 | −3 | +3 | +7 |
Table note: Averages from registered housing transactions in 2019, as printed in Table 2.4 of the OECD chapter, which gives no unit but maps dwelling size in square metres (Ahrend et al., 2023a). Only countries that record floor area feed these averages.
How steep, and how reliable?
Gradients differ a great deal between cities. In French cities the elasticity of land prices with respect to distance runs from about −50% at the steep end to essentially zero for some cities. The handbook review warns that early ring-average tests inflated the fit (Duranton & Puga, 2015). Appraisal-based land prices for US counties, ZIP codes and census tracts confirm what canonical urban models predict (Davis et al., 2021).
Why Do Some Cities Break the Pattern?
Two things pull cities away from the simple model: centres offer more than jobs, and few cities have only one centre. The handbook review points out that most cities are not strictly monocentric, and a 2001 study found subcentres in every large US city it examined. The useful question, it argues, is how far the model’s forces shape a city, not whether it has a single centre (Duranton & Puga, 2015).
Amenities and rich city centres
The simple model struggles to say where rich and poor households live. In American cities, average tract income tends to rise with distance from the densest tract and then flatten or decline, with U-shaped curves reported for New York, Chicago and Philadelphia. European cities tend to have rich cores and poorer peripheries (Duranton & Puga, 2015).
An amenity-based theory from 1999 offers one explanation. When the centre has a strong advantage in amenities over the suburbs, the rich are likely to live centrally; when that advantage is weak or negative, they are likely to live in the suburbs (Brueckner et al., 1999).
A theory that took on the puzzle of post-war land values rising at the edge of American cities now helps explain why house prices rose at the edge again from 2020.
What Did Remote Work Do to the Price Curve?
Remote work probably helped flatten the curve. In most US metropolitan areas the COVID-19 pandemic brought falls in house prices and rents in city centres and rises further out. The flattening was larger where working from home was more common, housing markets more regulated and supply less elastic (Gupta et al., 2022).
Later data showed the centre–suburb gap holding steady. Across the top 12 US cities, rent growth in dense areas fell about 15 percentage points behind the suburbs after March 2020, and the gap in home-value growth passed 40 percentage points by September 2023 (Ramani et al., 2024).
What the OECD’s own data show
The OECD chapter also found a shift, though a modest one. Between the first halves of 2019 and 2021, growth in both sales and prices in large metros rose with distance from the centre. Yet an area 10% further out saw only about 0.06 percentage points more price growth. With data ending in mid-2021, the authors warn that the results may mix transitory and permanent effects (Ahrend et al., 2023a).
Alonso’s model with fewer commuting days
One 2023 study reworks the urban spatial equilibrium for an economy with home working. It finds that working from home tends to flatten house-price gradients within cities, weakening the premium attached to good job access (Brueckner et al., 2023). In Alonso’s terms (Alonso, 1964), a household that commutes on fewer days pays less for distance, so it needs a smaller land-price discount to live far out.
Has the City Centre’s Pull Returned Since Offices Reopened?
Only partly, and the latest price evidence we found runs to the end of 2023. In a 2024 study, spending and population flows that had moved from centres to suburbs largely reverted in cities with low or moderate home working, but stayed large where it remained high. The authors expect the doughnut effect to persist while leaving wider metropolitan areas intact (Ramani et al., 2024). We found no peer-reviewed or official study measuring whether urban price gradients steepened again in 2025 or 2026.
Working patterns in Great Britain have settled into a mix. In August 2026, 24% of working adults both worked from home and travelled to work in the previous seven days, 13% only worked from home and 38% only travelled (Office for National Statistics, 2026).
For a household weighing a longer commute against a bigger home, Alonso’s trade-off still frames the choice (Alonso, 1964). What has changed is the price of distance, which now depends on how many days a week the journey is made. Whether prices near city centres recover depends on whether hybrid working holds, and the data do not yet answer that.
Frequently asked questions
What is bid-rent theory?
It explains land prices by what each user can afford to offer for a location. In Alonso’s version, households trade space for access to central jobs, so their bid for land falls with distance and plots grow larger further out. He derived such curves for firms and homes, and rent functions for farming (Alonso, 1964; Ahrend et al., 2023a).
Did Alonso test his model on real cities?
Not in any depth. The book is a theoretical monograph whose final chapter only sketches how empirical research might proceed (Alonso, 1964). Others later tested its predictions, for example with US land prices (Davis et al., 2021) and the OECD’s 13-country housing data (Ahrend et al., 2023a).
Is a home further out always cheaper overall?
No. The model predicts a lower price per square metre as distance grows, but homes further out tend to be larger, so the total price can go either way (Duranton & Puga, 2015). In New York average prices peak 5–10 km from the centre rather than in it (Ahrend et al., 2023a).
Did remote working make suburban homes more expensive?
Relative to city centres, it appears so, at least in large US cities. From 2020, prices and rents fell in city centres and rose further out, especially where home working was common (Gupta et al., 2022). Suburban home values outgrew dense areas by over 40 percentage points by September 2023 (Ramani et al., 2024).
Does land or the building drive house prices?
Mostly the land. A study of 14 advanced economies since 1870 found that rising land prices, not building costs, explain about 80% of the house-price boom since the Second World War (Knoll et al., 2017). US data show land prices outpacing house prices in large metros in 2012–19 (Davis et al., 2021).
Sources
- Alonso, W. (1964). Location and land use: Toward a general theory of land rent. Harvard University Press. – Cabdirect archive record 19641802976
- Ahrend, R., Bétin, M., Caldas, M. P., Cournède, B., Díaz Ramírez, M., Pionnier, P.-A., Sanchez Serra, D., Veneri, P., & Ziemann, V. (2023). Changes in the geography of housing demand after the onset of COVID-19. In OECD/KIPF, Bricks, taxes and spending: Solutions for housing equity across levels of government (pp. 21–43). OECD Publishing.
- Coblentz, H. S. (1966). [Review of the book Location and land use: Toward a general theory of land rent, by W. Alonso]. Natural Resources Journal, 6(1), 171.
- McDonald, J. F. (2007). William Alonso, Richard Muth, Resources for the Future, and the founding of urban economics. Journal of the History of Economic Thought, 29(1), 67–84.
- Duranton, G., & Puga, D. (2015). Urban land use. In G. Duranton, J. V. Henderson, & W. C. Strange (Eds.), Handbook of regional and urban economics (Vol. 5, pp. 467–560). Elsevier.
- Davis, M. A., Larson, W. D., Oliner, S. D., & Shui, J. (2021). The price of residential land for counties, ZIP codes, and census tracts in the United States. Journal of Monetary Economics, 118, 413–431.
- Brueckner, J. K., Thisse, J.-F., & Zenou, Y. (1999). Why is central Paris rich and downtown Detroit poor? An amenity-based theory. European Economic Review, 43(1), 91–107.
- Knoll, K., Schularick, M., & Steger, T. (2017). No price like home: Global house prices, 1870–2012. American Economic Review, 107(2), 331–353.
- Gupta, A., Mittal, V., Peeters, J., & Van Nieuwerburgh, S. (2022). Flattening the curve: Pandemic-induced revaluation of urban real estate. Journal of Financial Economics, 146(2), 594–636.
- Ramani, A., Alcedo, J., & Bloom, N. (2024). How working from home reshapes cities. Proceedings of the National Academy of Sciences, 121(45), e2408930121.
- Brueckner, J. K., Kahn, M. E., & Lin, G. C. (2023). A new spatial hedonic equilibrium in the emerging work-from-home economy? American Economic Journal: Applied Economics, 15(2), 285–319.
- Office for National Statistics. (2026). Public opinions and social trends, Great Britain: Working arrangements [Dataset].

Marcus Reed — author
Marcus Reed writes with an editorial focus on statistics and quantitative research, including effect sizes, regression models, uncertainty, associations and the numerical results reported in scientific studies. At Cabdirect, Marcus covers quantitative findings...
Related

The 1989 Molecular Cloning Manual: Why Labs Still Cite It

The Seven Countries Study: Diet and Heart Deaths in 1980

Animals, Fungi and Protozoa: How a 1998 Idea Held Up

Conservation Biology: Ecological Principles and Insularization

Gluconeogenesis From Glycine and Serine in the Rat

Secondary metabolites in tuberculosis: the 2010 review