





Self-Rated Health and Education: Findings from 69 Countries
Within countries, adults with less schooling tended to rate their health worse: in the 2002 World Health Survey, the odds of rating health bad or very bad were 2.29 times as high for the least-schooled adults as for the most-schooled (Subramanian et al., 2010). The pattern held among 219,713 adults in 69 countries, in every income group and region and in both sexes (Subramanian et al., 2010). Between countries the picture was different, because national rates of poor self-rated health tracked neither schooling nor life expectancy (Subramanian et al., 2010). The authors took the results as support for use within countries, but warned that, as a validation of the measure, the findings call for caution (Subramanian et al., 2010).
Below, we explain how the survey asked about health, what the analysis found and why a link with schooling is only indirect evidence that the question works. We then set the 2002 results against later studies of self-rated health and death, research on how groups use answer scales and current education gaps in Europe and in England and Wales. We do not rank countries by health or settle whether schooling itself improves health. The original study is summarised in Cabdirect archive record 20103097342.
What Did the 2002 World Health Survey Ask?
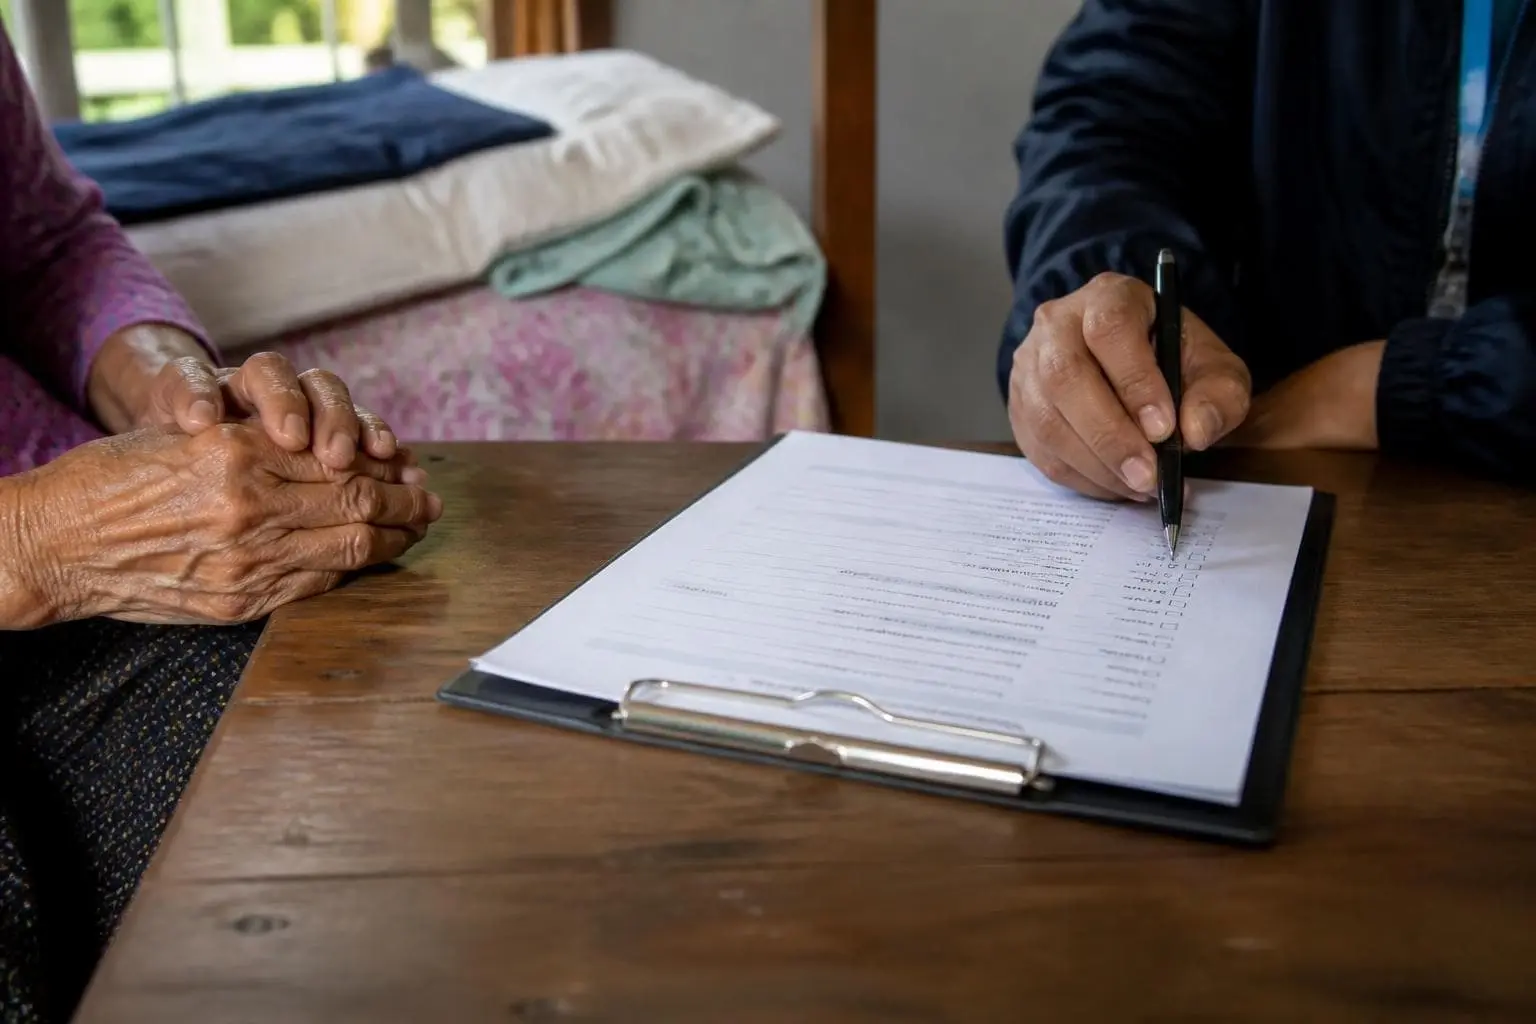
To measure self-rated health, the survey asked respondents one general question: “In general, how would you rate your health today”. The five possible answers were very good, good, moderate, bad or very bad (Subramanian et al., 2010). According to the paper, fieldwork ran from January to December 2002 in 69 countries on every continent (Subramanian et al., 2010). It covered adults aged 18 or over in private households, leaving out people on military bases, in group quarters and in other collective settings (Subramanian et al., 2010).
Ten countries drew a single-stage random sample, while the other 59 used multistage stratified samples of areas and then households, with one adult picked at random in each household (Subramanian et al., 2010).
How the analysis sample was built
For the 2010 analysis the authors kept respondents aged 25 or over, who were more likely to have finished their education, leaving 219,713 after 9,280 were dropped for missing answers. Bad or very bad counted as poor self-rated health; very good, good and moderate did not (Subramanian et al., 2010).
Education was measured as reported years of schooling, because school levels are hard to compare between countries, and entered the models both as years and as fifths, or quintiles, of each country’s own distribution (Subramanian et al., 2010).
What Did the Study Find?
Across all 69 countries, 9.8% of adults rated their health bad or very bad, and those with more schooling did so less often (Subramanian et al., 2010). Each extra year of schooling was linked to about 7% lower odds of poor self-rated health: the odds ratio was 0.929, with a 95% confidence interval (CI) of 0.926–0.933 (Subramanian et al., 2010). Adults in the lowest schooling quintile had 2.29 times the odds of those in the highest (95% CI 2.165–2.426) (Subramanian et al., 2010).
Results by income group and region
The gradient appeared in every income group, with odds ratios per year from 0.910 in high-income to 0.948 in low-income countries (Subramanian et al., 2010). The authors cautioned that its size is hard to compare between countries (Subramanian et al., 2010). By region it ranged from 0.903 in Europe and central Asia to 0.949 in sub-Saharan Africa (Subramanian et al., 2010). Men and women showed almost identical estimates (Subramanian et al., 2010).
Differences between countries
According to the authors, the inverse link appeared in every country, though not always at conventional statistical significance, and in 15 countries, among them Australia, Sweden, Ethiopia and Nepal, the change per year of schooling was small (Subramanian et al., 2010). An ordered model using all five answers gave the same patterns (Subramanian et al., 2010).
Rates of poor self-rated health varied widely, from 48.9% in Swaziland, renamed Eswatini in 2018 (United Nations, n.d.), to 2.5% in Australia, the United Arab Emirates and Uruguay (Subramanian et al., 2010). Median schooling ranged from 14 years in Belgium, France and Israel to zero in 11 countries, most of them in Africa (Subramanian et al., 2010).
Does a Link With Schooling Show the Question Works?
Only indirectly: a gradient by schooling is what a working question should produce, but on its own it cannot show that the answers are accurate (Subramanian et al., 2010). The worry behind the study is known as reporting heterogeneity. People judge their health against their own social experience, so critics have argued that those who are disadvantaged may fail to notice or report illness (Subramanian et al., 2010). If that bias were large, less-schooled adults would look healthier than they are, and the expected gradient would weaken.
The authors found the gradient in every income group and region and suggested that under-reporting of poor health by less-educated adults was not large enough to mislead (Subramanian et al., 2010). They added that disadvantaged people might still understate poor health, so as a validation the results “must be interpreted with caution” (Subramanian et al., 2010).
The country figures show why comparisons across borders are harder. Among individuals, more schooling went with less reported poor health (r = −0.143), but national rates correlated neither with median schooling (r = −0.091) nor with life expectancy (r = −0.198) (Subramanian et al., 2010). Sweden’s 15.5% rate was higher than those of Ethiopia (6.5%) or Myanmar (2.9%), so such figures are a poor basis for ranking countries by health (Subramanian et al., 2010).
What anchoring vignettes add
Anchoring vignettes are short descriptions of imaginary people whose health respondents rate on the same scale they use for themselves (Subramanian et al., 2010). Differences in how groups rate the same vignette reveal differences in rating style. In a study by Bago d’Uva and colleagues, correcting for such differences slightly narrowed education gaps in health in India and Indonesia, but not in China (Bago d’Uva et al., 2008). They found reporting differences but no substantial reporting bias (Bago d’Uva et al., 2008).
Every answer to a health question reflects both the person’s health and the yardstick they use to judge it.
Does Self-Rated Health Predict Death?
In many cohorts it does (DeSalvo et al., 2006), and predicting death is the stronger test that the 2010 authors proposed (Subramanian et al., 2010). A 2006 meta-analysis pooled 22 cohorts that asked a single general question. Compared with people who rated their health excellent, all-cause mortality risk was 1.23 times as high for good, 1.44 for fair and 1.92 for poor (DeSalvo et al., 2006). The link held in analyses limited to studies that adjusted for other illnesses, functional status, cognition and depression (DeSalvo et al., 2006).
Evidence from low- and middle-income countries
The 2010 paper called self-rated health a robust predictor of mortality in industrialised countries and cited evidence from Bangladesh and Indonesia that the same might hold in poorer ones (Subramanian et al., 2010). Later cohorts tested this in poorer settings. In a surveillance area of rural Indonesia, 11,753 adults aged 50 or over were followed for an average of 36 months (Ng et al., 2012). After adjustment, men and women who reported bad health had hazard ratios for death of 3.0 and 4.9, and education did not modify the link (Ng et al., 2012).
In rural Pune district, India, 5,087 adults aged 50 or over answered a shortened questionnaire from WHO’s Study on Global AGEing and Adult Health (SAGE), and 410 died within about three years (Hirve et al., 2012). Bad or very bad self-rated health predicted death in men (hazard ratio 3.06) (Hirve et al., 2012). In women the estimate was 1.64, which was not statistically significant once disability was taken into account (Hirve et al., 2012).
Self-rated health also captures more than the risk of dying. The authors of the 2010 paper noted that the measure includes aspects of mental health, so differences in answers need not mirror differences in mortality (Subramanian et al., 2010).
How Is the Question Asked Today?
Most OECD countries now use a five-point scale running from very good to very bad, but several use a different one, and wording still varies in ways that affect comparisons (OECD, 2025). On average across OECD countries, around 8% of people aged 15 or over rated their health bad or very bad in 2024 or the nearest year (OECD, 2025). Australia, Canada, Chile, Colombia, New Zealand and the United States use an asymmetric scale from excellent to poor, which the OECD warns may tilt answers towards a more positive view (OECD, 2025).
The two scales are closely related but not interchangeable. A 2008 study of 11,643 people aged 50 or over in five European countries, co-written by Mauricio Avendano, one of the three authors of the 2010 paper, asked both versions (Jürges et al., 2008). Answers were strongly correlated, but health levels could not be compared directly without rescaling (Jürges et al., 2008).
Wording and time frames
The 2002 survey asked about health “today” (Subramanian et al., 2010). The census in England and Wales asks “How is your health in general?”, and the Office for National Statistics notes that the answer is not tied to any time period (Office for National Statistics, n.d.-a). The census offered the same five answers, from very good to very bad, in 2011 and 2021 (Office for National Statistics, n.d.-a).
The education gap in current data
Among all adults aged 16 or over in the EU, the gap in good or very good health between the lowest and highest education groups has changed little: 23.8 percentage points in 2019, 26.5 in 2020 and 23.0 in 2025 (Eurostat, 2026). In England and Wales, age-standardised Census 2021 data for adults aged 25 or over show 13.0% rating their health bad or very bad among those with no qualifications and 4.1% among those qualified at Level 4 or above, which includes degrees (Office for National Statistics, n.d.-b).
What Can One Health Question Tell Us?
Within one country, a single health question can show which groups are worse off, but it is a weaker guide to differences between countries (Subramanian et al., 2010; OECD, 2025). That reading rests on the 2002 survey’s consistent gradient (Subramanian et al., 2010), on mortality studies in richer and poorer settings (DeSalvo et al., 2006; Hirve et al., 2012; Ng et al., 2012) and on vignette research that finds rating differences of varying direction (Bago d’Uva et al., 2008; Grol-Prokopczyk et al., 2011; Dowd & Todd, 2011). None of it shows that answers mean exactly the same in every group.
Limits of the 2010 analysis
The analysis adjusted only for age and sex, and it left out urban and rural differences because definitions vary between countries (Subramanian et al., 2010). Detailed results by country, sex and schooling quintile were published only as online appendices (Subramanian et al., 2010).
WHO surveys after 2002
SAGE collects data on adults, with an emphasis on those aged 50 or over, in China, Ghana, India, Mexico, the Russian Federation and South Africa; its third wave was completed in March 2020 (World Health Organization, n.d.-a). WHO is now developing the World Health Survey Plus, a modular household health examination survey with open data, piloted in eight settings between 2023 and 2025 (World Health Organization, n.d.-b).
Frequently asked questions
What is self-rated health?
It is a person’s own overall judgement of their health, usually given on a five-point scale. The 2002 World Health Survey asked how respondents rated their health today, from very good to very bad (Subramanian et al., 2010). The census in England and Wales asks about health in general, with no time period attached (Office for National Statistics, n.d.-a).
Were adults with little schooling really twice as likely to report poor health?
Not exactly. The figure of 2.29 is an odds ratio comparing the lowest and highest schooling quintiles, pooled across 69 countries (Subramanian et al., 2010). When an outcome affects about one person in ten, odds ratios run higher than risk ratios, so the ratio of risks was somewhat lower. The paper does not report enough to calculate it.
Can self-rated health be used to rank countries?
Only with great care. In 2002, national rates of poor health bore no clear relation to median schooling or life expectancy (Subramanian et al., 2010). Scales also differ: the OECD notes that the excellent-to-poor version used in the United States and five other member countries may make self-ratings look more favourable (OECD, 2025).
Does self-rated health predict how long people live?
In many cohorts, yes. A 2006 meta-analysis found mortality risk nearly twice as high among people rating their health poor as among those rating it excellent (DeSalvo et al., 2006). Studies of older adults in rural Indonesia and India found similar links, although the Indian result for women was not statistically significant (Hirve et al., 2012; Ng et al., 2012).
Do people with more education rate their health differently?
Sometimes, and not always in the same direction. Vignette studies suggest that schooling can shape how people use answer scales (Grol-Prokopczyk et al., 2011). In India and Indonesia, correcting for this slightly narrowed education gaps (Bago d’Uva et al., 2008), while in an American study uncorrected answers understated them (Dowd & Todd, 2011).
Sources
- Subramanian, S. V., Huijts, T., & Avendano, M. (2010). Self-reported health assessments in the 2002 World Health Survey: how do they correlate with education? Bulletin of the World Health Organization, 88(2), 131–138. – Cabdirect archive record 20103097342
- DeSalvo, K. B., Bloser, N., Reynolds, K., He, J., & Muntner, P. (2006). Mortality prediction with a single general self-rated health question. A meta-analysis. Journal of General Internal Medicine, 21(3), 267–275.
- Hirve, S., Juvekar, S., Sambhudas, S., Lele, P., Blomstedt, Y., Wall, S., Berkman, L., Tollman, S., & Ng, N. (2012). Does self-rated health predict death in adults aged 50 years and above in India? Evidence from a rural population under health and demographic surveillance. International Journal of Epidemiology, 41(6), 1719–1727.
- Ng, N., Hakimi, M., Santosa, A., Byass, P., Wilopo, S. A., & Wall, S. (2012). Is self-rated health an independent index for mortality among older people in Indonesia? PLoS ONE, 7(4), e35308.
- Bago d’Uva, T., Van Doorslaer, E., Lindeboom, M., & O’Donnell, O. (2008). Does reporting heterogeneity bias the measurement of health disparities? Health Economics, 17(3), 351–375.
- Grol-Prokopczyk, H., Freese, J., & Hauser, R. M. (2011). Using anchoring vignettes to assess group differences in general self-rated health. Journal of Health and Social Behavior, 52(2), 246–261.
- Dowd, J. B., & Todd, M. (2011). Does self-reported health bias the measurement of health inequalities in U.S. adults? Evidence using anchoring vignettes from the Health and Retirement Study. The Journals of Gerontology, Series B: Psychological Sciences and Social Sciences, 66(4), 478–489.
- Jürges, H., Avendano, M., & Mackenbach, J. P. (2008). Are different measures of self-rated health comparable? An assessment in five European countries. European Journal of Epidemiology, 23(12), 773–781.
- OECD. (2025). Health at a Glance 2025: OECD Indicators. OECD Publishing.
- Eurostat. (2026). Self-perceived health by sex, age and educational attainment level (hlth_silc_02) [Data set].
- Office for National Statistics. (n.d.). General health variable: Census 2021. Census 2021 dictionary.
- Office for National Statistics. (n.d.). Census 2021 observations: general health by highest level of qualification and age, England and Wales [Data set, queried 25 September 2026].
- World Health Organization. (n.d.). Study on Global AGEing and Adult Health (SAGE). WHO Multi-Country Studies Data Archive.
- World Health Organization. (n.d.). World Health Survey Plus (WHS+). WHO Multi-Country Studies Data Archive.
- United Nations. (n.d.). Eswatini. Member States.

Eleanor Hayes — author
Eleanor Hayes writes with an editorial focus on research methodology and study design, including experimental and observational studies, controls, sampling, measurement and the methodological choices that shape scientific conclusions. At CAB Direct, Eleanor co...
Related

Chinese tourism research: questionnaire barriers in Kanas

Balkan Pine Growth in Bulgaria: A 2010 Growth Model

How Accurate Are Self-Reported Recreation Participation Rates?

Rapid Detection Methods for Genetically Modified Agricultural Products
Equine Anatomy and Clinical Examination in the 2010 Third Edition

Athletes accused of sexual assault: arrests and convictions