







Iron rich foods and how to get more from your diet
An iron rich food is not simply a food with a lot of iron in it: what reaches the blood depends on the chemical form of that iron and on what is eaten alongside it, and in one classic measurement the same men absorbed 37% of the haem iron in their meals and 5% of the non-haem iron (Björn-Rasmussen et al., 1974). Between a twentieth and a seventh of the iron in a mixed diet is absorbed at all (Kolarš et al., 2025). Further coverage of nutrients sits in the [nutrition section](/nutrition/).
This explainer separates content from availability. It starts with what the national food tables actually measure, follows the two forms of dietary iron and their different fates, sets out what a meal does to the vulnerable fraction and by how much, then looks at the awkward finding that effects this large at one meal mostly disappear across a whole diet.

Evidence last checked 9 Nov 2026 · 11 min
What the food tables actually measure
National food composition databases answer one question: how much iron is in the food. The United States tables and the British ones both report iron in milligrams per 100 grams, and both record how many separate analyses lie behind each number (USDA, 2018; Public Health England, 2021). That second column is the one popular lists leave out, and it changes how the first should be read.
Take beans. The United States entry for cooked beans rests on 54 separate determinations, and those determinations range from 1.33 to 8.20 milligrams per 100 grams, a sixfold spread inside a single food (USDA, 2018). Kale behaves the same way, from 0.77 to 3.61 across five analyses. A list that prints one number for beans is not wrong so much as silent about the variation underneath it.
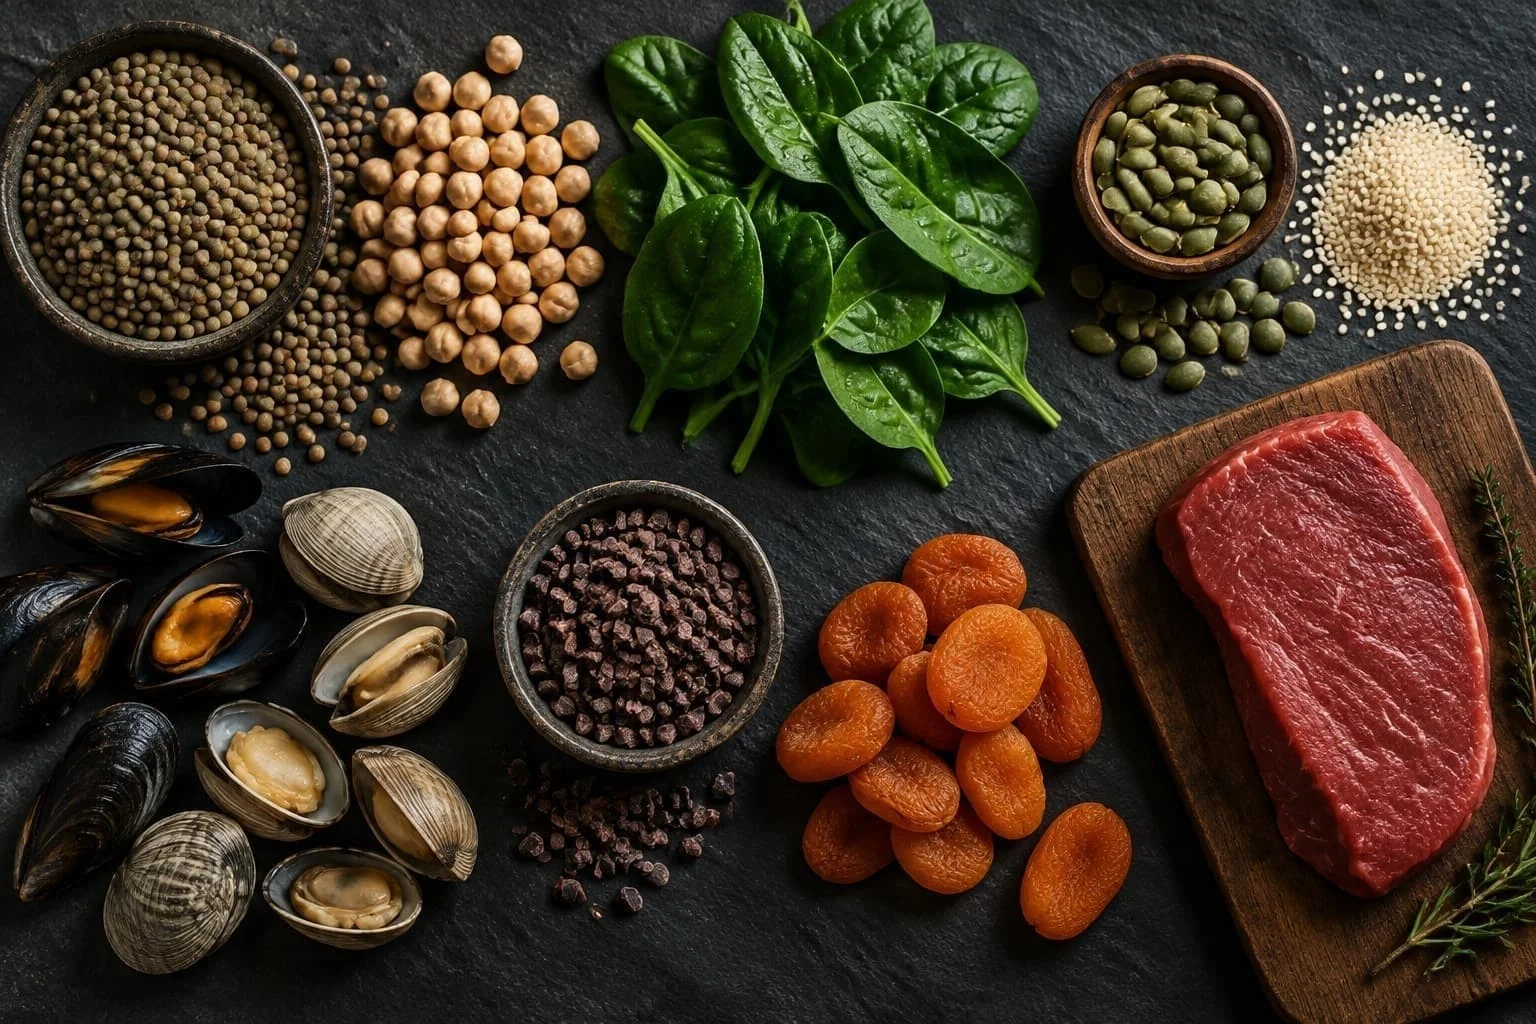
The ranking also contains surprises. Unsweetened cocoa powder holds 13.86 milligrams per 100 grams against 6.54 for braised beef liver, so a plant food outranks beef liver here. Oysters reach 9.21 while baked sockeye salmon sits at 0.52, an eighteenfold gap inside the category people usually treat as one: salmon carries less iron than skinless chicken breast (USDA, 2018). Beef tenderloin, at 1.95, is close to dark turkey meat at 1.43, which already suggests that the reputation of red meat rests on something other than how much iron it contains.
Some entries also deserve more caution than their position suggests. Braised pork liver tops the offal group at 17.92 milligrams per 100 grams, but that value carries no analytical determinations at all and was calculated rather than measured, while chicken liver at 12.88 and beef liver at 6.54 each rest on four analyses (USDA, 2018). Among British meat entries the highest reading is not a steak but fried black pudding at 12.30, which is made from blood (Public Health England, 2021).
One more comparison is worth naming, because it is read as cookery. Boiled drained spinach is listed at 3.57 milligrams per 100 grams and raw spinach at 2.71 (USDA, 2018). These are two separate entries for two states of the food, not one sample measured before and after a pan, so the pair does not show what boiling does to a given portion. The British tables carry a third entry, dried spinach at 18.20, which sits far above both (Public Health England, 2021).
Iron content of selected foods (USDA, 2018)
Food and preparation | Iron (mg per 100 g) | Source |
Cocoa powder, unsweetened, dry | 13.86 | USDA (2018) |
Oysters, eastern, wild, cooked | 9.21 | USDA (2018) |
Beef liver, cooked, braised | 6.54 | USDA (2018) |
Spinach, cooked, boiled, drained | 3.57 | USDA (2018) |
Spinach, raw | 2.71 | USDA (2018) |
Note: values describe total iron in 100 g of the named food and preparation, not the amount absorbed by the body (USDA, 2018). Absorption also depends on the chemical form of the iron and on the composition of the meal (Pasricha et al., 2021).
Haem and non-haem iron take different routes
Dietary iron arrives in two chemical forms. Haem iron comes from the haemoglobin and myoglobin of animal tissue and is taken up as an intact molecule. Non-haem iron, which is everything else, has to be released from the food and chemically reduced first, and that step is open to interference (Pasricha et al., 2021). Haem iron comes mainly from animal foods such as meat, fish and shellfish, and in red meats, 72–87% of total iron was in haem form (Lombardi-Boccia et al., 2002).
The size of the difference was settled by one series of a two-pool study in young men, on meals modelled on their own six-week intake: 37% of the haem iron was absorbed against 5% of the non-haem iron (Björn-Rasmussen et al., 1974). That is roughly a sevenfold gap in the same people on the same day, which is why the arithmetic of a mixed diet comes out so lopsided. Haem accounts for about a tenth of the iron eaten by people who eat meat and supplies more than two fifths of what they absorb (Kolarš et al., 2025).
The iron printed in a food table is the iron on the plate, not the iron in the blood, and the distance between the two is the whole subject.
What a meal does to non-haem iron
Non-haem iron is particularly sensitive to the composition of a meal. Controlled studies show that ascorbic acid can increase its absorption, while polyphenol-rich beverages can reduce it (Cook & Monsen, 1977; Hurrell et al., 1999).
Ascorbic acid added to a test meal raised absorption in proportion to the amount added, with ratios running from 1.65 at the smallest addition tested to 9.57 at the largest (Cook & Monsen, 1977). The same study found the enhancement much weaker when the meal already contained meat, and found that a large amount given at breakfast did nothing for the iron in lunch or dinner. The effect belongs to the meal, not to the day. The enhancer itself is fragile and handling costs some of it, as in the account of [what shipping, freezing and canning do to vitamin C](/nutrition/vitamin-c-in-peas-effects-of-shipping-freezing-and-canning/).
Inhibition is measured just as sharply. With a hamburger meal, a cup of coffee cut iron absorption by 39% and tea cut it by 64% (Morck et al., 1983). In a semi-purified meal the same group measured absorption falling from 5.88% without coffee to 1.64% with filter coffee and 0.97% with instant, and halving again when the instant coffee was made double strength. The timing result is the most instructive: coffee taken an hour before the meal had no effect at all, while coffee an hour after it inhibited absorption as strongly as coffee with the food.
Polyphenols explain the pattern across drinks. Beverages supplying modest amounts of total polyphenols reduced non-haem absorption by 50% to 70% against a water control, and richer ones by 60% to 90%, with black tea at 79% to 94%, cocoa at 71% and chamomile at 47% (Hurrell et al., 1999). Adding milk changed little. Note where this leaves cocoa: the food with the most iron in the table is also a strong inhibitor of the form of iron it contains.
Drinks are only part of it. Phytates, which occur in grains, pulses and seeds, and calcium both reduce the uptake of non-haem iron, and the chemistry of the gut itself belongs on the list: iron has to stay soluble to be absorbed, so reduced stomach acidity lowers uptake, as does surgery that bypasses the part of the intestine where iron is taken up (Pasricha et al., 2021). Phytates and polyphenols mainly affect non-haem iron. The effects observed in single-meal experiments do not necessarily predict the changes measured across a complete diet (Hurrell et al., 1999; Cook et al., 1991).
Why the meal is not the diet
Here the subject turns on itself. When the same manipulations are applied to whole diets rather than to single test meals, the effects shrink, and sometimes vanish. Measured across a complete ordinary diet, non-haem absorption was 6.4%, against 6.1% in representative single meals from it; when the diet was rebuilt to maximise absorption, the whole-diet figure rose only to 8.0%, while the same manipulation in single-meal format reached 13.5% (Cook et al., 1991).
The clearest test used vitamin C, the best known enhancer of all. Twelve participants ate complete diets labelled with two iron isotopes across three periods, with a fivefold difference in daily vitamin C between the lowest and highest. Absorption came out at 4.57% on free choice, 7.69% on the high intake and 5.69% on the low one, and the three periods did not differ significantly (Cook & Reddy, 2001). The authors stated the conclusion plainly: the facilitating effect of vitamin C on iron absorption from a complete diet is far less pronounced than from single meals.
That study was small, with power to detect only a large shift, and the authors said so. But the same gap between single meals and whole diets has turned up in the studies that looked for it, which is why single-meal numbers should be read as measurements of a mechanism rather than as predictions about anyone's week.
Diets without meat, and how the gut adapts
Controlled feeding puts a figure on the difference. Women eating a weighed lacto-ovo-vegetarian diet absorbed 1.1% of its non-haem iron against 3.8% on a non-vegetarian diet, roughly a 70% reduction (Hunt & Roughead, 1999). The striking part is what did not follow: over eight weeks, haemoglobin, transferrin saturation and serum ferritin did not differ between the diets. A threefold gap in measured absorption left no mark on the blood in that time.
Part of the reason is that the gut adjusts. Thirty-one men ate diets built to differ eightfold in iron bioavailability, and eighteenfold in haem iron, while carrying almost the same total iron. Over ten weeks absorption fell on the high availability diet and rose on the low one, the adaptation affected non-haem iron only, and the measured gap between the diets narrowed from eightfold to fourfold (Hunt & Roughead, 2000). Reviews of vegetarians find this in the stores rather than the blood count, with ferritin about 30 micrograms per litre lower than in meat eaters (Pasricha et al., 2021).
An early [study of dietary iron and hair growth](/research/dietary-iron-and-hair-growth-cunninghams-1932-rat-study/) found that severe iron deficiency caused hair loss in young rats, while supplying iron prevented or reversed the effect (Cunningham, 1932). However, these animal findings cannot establish the causes of hair loss in humans or predict how much iron a person absorbs from their diet.
Added iron and where it ends up
A large share of the iron in modern diets was put there deliberately. The British dataset contains the cleanest demonstration, because fortified and unfortified versions of the same product were analysed in one survey: corn flakes with added iron held 11.80 milligrams per 100 grams, the unfortified version 0.40 (Public Health England, 2021). Nearly all the iron in the fortified product is added iron. The same contrast runs through the American tables, where enriched wheat flour carries roughly four times the iron of unenriched flour (USDA, 2018).
That matters for any list of iron rich foods, because fortified cereals are not a marginal item. Among older adults in the United States, ready-to-eat cereals ranked first out of 46 food categories for contribution to iron intake, ahead of every meat, pulse and vegetable, with breads and rolls second (Papanikolaou & Fulgoni, 2018). That analysis covers adults aged 51 and over rather than the whole population, so the ranking should not be read as universal. It does show that a food can dominate the iron supply on the strength of what was added to it.
There is a wrinkle in that arrangement. Added iron is non-haem iron, the fraction the rest of the meal acts on, so the breakfast that supplies the most iron on paper is also the one most exposed to whatever is drunk alongside it (Hurrell et al., 1999). Composition tables and absorption studies are measuring two different quantities, and fortified foods are where the distance between them is widest.
What the evidence supports and what it does not
Well supported: haem and non-haem iron are absorbed at markedly different rates, and the non-haem fraction responds to other components of a meal (Björn-Rasmussen et al., 1974; Morck et al., 1983). The measured effects of dietary inhibitors are reproducible in controlled meal studies, while food composition measurements also show substantial variation (Morck et al., 1983; USDA, 2018).
Not supported: treating a ranking of total iron content as a ranking of the iron absorbed from food. Raw spinach contains 2.71 milligrams of iron per 100 grams, less than cocoa, liver and oysters in the same food composition tables (USDA, 2018). However, these figures describe total iron content rather than the amount absorbed, which also depends on the chemical form of iron and the composition of the meal (Pasricha et al., 2021).
Unsettled: how far any of the meal-level measurements predict what a varied diet delivers over weeks, which is the number that would actually matter. The whole-diet studies are small, and the controlled vegetarian trial left blood measures untouched over two months (Cook et al., 1991; Hunt & Roughead, 2000; Hunt & Roughead, 1999). The honest summary is that the mechanisms are well mapped at the scale of a plate and poorly quantified at the scale of a diet. What happens when a diet leans heavily on plants is measured in [a mainly fruit diet and its biochemical effects](/nutrition/mainly-fruit-diet-biochemical-effects-nutrition/).
Frequently asked questions
Which food has the most iron?
Among ordinary unfortified foods the ranking surprises: unsweetened cocoa powder holds about twice the iron of braised beef liver per 100 grams, and dried spinach more still, because drying removes water and concentrates what remains. Content alone, though, says nothing about how much of it is absorbed.
Does cooking destroy iron in vegetables?
No. In the same database boiled spinach is listed higher than raw spinach, 3.57 against 2.71 milligrams per 100 grams, but these are separate entries for different states of the food rather than one sample measured twice, so they do not show the effect of boiling. Heat does reduce the haem fraction in meat.
Is iron from supplements the same as iron from food?
Standard tablets contain non-haem iron, the same form found in plants and fortified products, so it meets the same obstacles in the gut; haem iron supplements also exist but are far less common. Haem iron comes from meat, poultry, fish and shellfish, and reaches the blood by a separate route that the rest of the meal barely touches.
Why do food tables disagree about the same vegetable?
Because the value is an average of separate laboratory analyses, and the analyses themselves vary with variety, soil and season. The American entry for cooked beans rests on 54 determinations spanning a sixfold range, so a single printed number hides a wide distribution behind it.
Does black pudding count as an iron rich food?
By composition it is among the strongest entries in the British dataset, higher than most cuts of meat, because it is made from blood and the iron in it is largely haem iron. That combination of high content and the better absorbed chemical form is unusual among everyday foods.
Sources
- Björn-Rasmussen E, Hallberg L, Isaksson B, Arvidsson B. Food iron absorption in man: applications of the two-pool extrinsic tag method to measure heme and nonheme iron absorption from the whole diet. Journal of Clinical Investigation. 1974;53(1):247–255. DOI 10.1172/JCI107545.
- Cook JD, Monsen ER. Vitamin C, the common cold, and iron absorption. American Journal of Clinical Nutrition. 1977;30(2):235–241. DOI 10.1093/ajcn/30.2.235.
- Cook JD, Dassenko SA, Lynch SR. Assessment of the role of nonheme-iron availability in iron balance. American Journal of Clinical Nutrition. 1991;54(4):717–722. DOI 10.1093/ajcn/54.4.717.
- Cook JD, Reddy MB. Effect of ascorbic acid intake on nonheme-iron absorption from a complete diet. American Journal of Clinical Nutrition. 2001;73(1):93–98. DOI 10.1093/ajcn/73.1.93.
- Cunningham IJ. Influence of dietary iron on hair and wool growth. New Zealand Journal of Agriculture. 1932;44:335–337. archive record 19321401596
- Hunt JR, Roughead ZK. Nonheme-iron absorption, fecal ferritin excretion, and blood indexes of iron status in women consuming controlled lactoovovegetarian diets for 8 wk. American Journal of Clinical Nutrition. 1999;69(5):944–952. DOI 10.1093/ajcn/69.5.944.
- Hunt JR, Roughead ZK. Adaptation of iron absorption in men consuming diets with high or low iron bioavailability. American Journal of Clinical Nutrition. 2000;71(1):94–102. DOI 10.1093/ajcn/71.1.94.
- Hurrell RF, Reddy M, Cook JD. Inhibition of non-haem iron absorption in man by polyphenolic-containing beverages. British Journal of Nutrition. 1999;81(4):289–295. DOI 10.1017/S0007114599000537.
- Kolarš B, Mijatović Jovin V, Živanović N, et al. Iron deficiency and iron deficiency anemia: a comprehensive overview of established and emerging concepts. Pharmaceuticals. 2025;18(8):1104. DOI 10.3390/ph18081104.
- Lombardi-Boccia G, Martinez-Dominguez B, Aguzzi A. Total heme and non-heme iron in raw and cooked meats. Journal of Food Science. 2002;67(5):1738–1741. DOI 10.1111/j.1365-2621.2002.tb08715.x.
- Morck TA, Lynch SR, Cook JD. Inhibition of food iron absorption by coffee. American Journal of Clinical Nutrition. 1983;37(3):416–420. DOI 10.1093/ajcn/37.3.416.
- Papanikolaou Y, Fulgoni VL. Grains contribute shortfall nutrients and nutrient density to older US adults: data from the National Health and Nutrition Examination Survey, 2011–2014. Nutrients. 2018;10(5):534. DOI 10.3390/nu10050534.
- Pasricha SR, Tye-Din J, Muckenthaler MU, Swinkels DW. Iron deficiency. The Lancet. 2021;397(10270):233–248. DOI 10.1016/S0140-6736(20)32594-0.
- Public Health England. McCance and Widdowson's The Composition of Foods Integrated Dataset (CoFID). London: Public Health England; 19 March 2021. https://www.gov.uk/government/publications/composition-of-foods-integrated-dataset-cofid
- United States Department of Agriculture, Agricultural Research Service. FoodData Central: SR Legacy Foods, release April 2018. Washington DC: USDA ARS. https://fdc.nal.usda.gov

Elias R. Westbrook — author
Elias R. Westbrook is academic background in human nutrition and nutritional sciences, with a focus on food composition, nutrient intake, dietary patterns, and the relationship between foods and nutritional health. For Cabdirect, this persona is intended to co...
This article is for general information and is not medical advice. It was reviewed for accuracy by a qualified clinician; decisions about your health should be made with your own doctor.
Related
Vitamin C in Peas: Effects of Shipping, Freezing and Canning
Mainly fruit diet study: biochemical effects in 1971
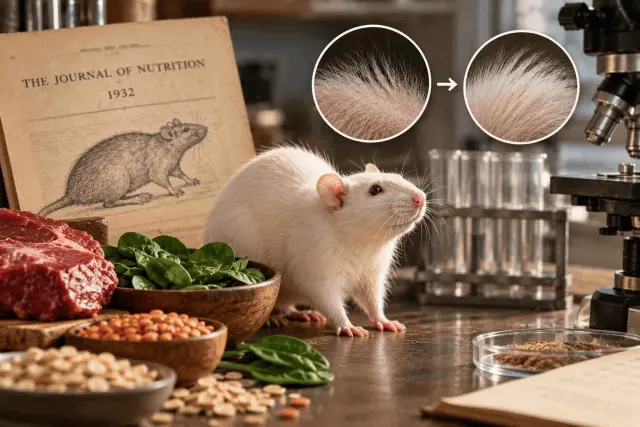
Dietary Iron and Hair Growth - Cunningham’s 1932 Rat Study
How omega-3 fatty acids EPA, DHA and ALA differ and why it matters
Magnesium for sleep and what the research really shows
Vitamin K and why your body needs it for healthy bones