

















Vitamin B12 deficiency and the signs you should know
Neurological symptoms of vitamin B12 deficiency can occur with a normal blood count. For example, in a series of 141 patients with neuropsychiatric disorders caused by the deficiency, 40 (28%) had a normal haematocrit, a normal red cell volume, or both (Lindenbaum et al., 1988). Further coverage of nutrients sits in the nutrition section.
This explainer sets out what those early signs look like, why the standard blood test is argued about, what the delay between first symptom and diagnosis costs, and which groups the evidence actually places at risk. It draws on hospital series, national survey data, a 2025 review of laboratory practice and the primary studies behind the numbers.

Evidence last checked 9 Nov 2026 · 10 min
The signs that appear before the blood count moves
The classic teaching tied B12 deficiency to a large-cell anaemia, and that link is what makes the condition easy to miss. In the New England Journal of Medicine series that broke it, 141 consecutive patients had neuropsychiatric disorders from cobalamin deficiency, and in 40 of them, 28%, at least one red cell measure was normal (Lindenbaum et al., 1988). Their complaints were paraesthesiae, loss of sensation, unsteady walking and memory loss. Diets built almost entirely on plants shift several blood measures together, as in a mainly fruit diet and its biochemical effects.
The finding has been reproduced rather than left as a curiosity. Across 434 documented episodes of cobalamin deficiency, haematocrit was normal in 28% and red cell volume in 17% (Savage et al., 1994). In a cohort of older patients whose deficiency came from failure to release B12 from food, the leading features were a mild sensory neuropathy in 44.6% and confusion or declining mental function in 22.8%, while anaemia appeared in 21% (Andrès et al., 2005). Neurological complaints are not a late complication in these series; they are the presenting problem.
What the nerves show is specific enough to be recognisable. Across 153 episodes in two New York hospitals, paraesthesiae or unsteadiness were usually the first symptoms, and the most frequent objective findings were reduced vibration sense and position sense in the legs; incontinence, orthostatic drops in blood pressure, visual loss, dementia and mood disorder all appeared, often several in the same patient (Healton et al., 1991).
Why a big-cell anaemia is the wrong thing to wait for
B12 works as a cofactor in DNA synthesis, in methylation reactions and in mitochondrial metabolism (Green et al., 2017). When DNA synthesis stalls, the developing red cell keeps growing without dividing, which is where the enlarged cells of the textbook picture come from. Iron deficiency does the opposite, leaving cells that divide normally with too little haemoglobin to fill them, which is why the two deficiencies are often described as a matched pair of large cells and small ones.
The trouble is that the large cells are an unreliable signal. In the series of 434 deficiency episodes, red cell volume was normal in 17% of episodes, so roughly one in six documented episodes had no red-cell size abnormality (Savage et al., 1994). The two blocked reactions leave a chemical trace instead: methylmalonic acid and homocysteine accumulate, and in the patients without anaemia both were markedly raised (Lindenbaum et al., 1988). That is the basis for using a functional marker rather than the blood film to settle the question.
Why the delay matters more than the number
In the same New York series the median time from first symptom to diagnosis and treatment was four months, and in some patients far longer. Among those without anaemia, the neurological state often continued to deteriorate while the haematocrit stayed normal. Of the episodes followed up, 47.1% recovered completely and 6.3% were left with moderate or severe disability, and the degree of improvement was inversely related to the haematocrit (Healton et al., 1991).
A normal blood count is not reassurance in this condition: in the hospital series longer delay before diagnosis went together with less complete recovery.
At follow-up, all 39 patients assessed showed neuropsychiatric improvement, and the raised methylmalonic acid or homocysteine fell by more than half in all 31 in whom it was measured (Lindenbaum et al., 1988). The biochemical markers fell by more than half in every patient assessed; what did not always come back was the nerve function lost while nobody was looking.
Patient-reported data point the same way. In a survey of 1,117 members of a pernicious anaemia association, answered between 2010 and 2012, a latent class analysis separated three symptom profiles, and in the highest burden group, 29.9% of the sample, fatigue was reported by 99.4% and memory loss by 97.9%; that group also had the longest diagnostic delay (Morris et al., 2026). These are self-reports from an organised patient group rather than a population estimate, but the association between delay and burden is consistent with the clinical series.
What clinical studies show about vitamin B12 deficiency
Study and sample | Reported findings | What the result means |
Lindenbaum et al. (1988)141 patients with neuropsychiatric manifestations | 40 patients (28%) had a normal haematocrit, a normal red cell volume, or both; both were normal in 19. | Neurological symptoms can occur even when standard blood-count indicators are normal. |
Savage et al. (1994)434 documented episodes | Haematocrit was normal in 28% of episodes; mean red-cell volume was normal in 17%. | Neither a normal haematocrit nor a normal cell-volume result excludes deficiency. |
Healton et al. (1991)153 episodes assessed | Among followed-up episodes, 47.1% had complete neurological recovery and 6.3% had residual moderate or severe disability. | Neurological recovery was not complete in every case, emphasising the importance of timely recognition. |
Note: these studies assessed different outcomes: blood-count findings in the first two and neurological recovery in the third. Their percentages therefore describe distinct clinical measures and should not be compared as equivalent outcomes.
How B12 gets in, and where the route breaks
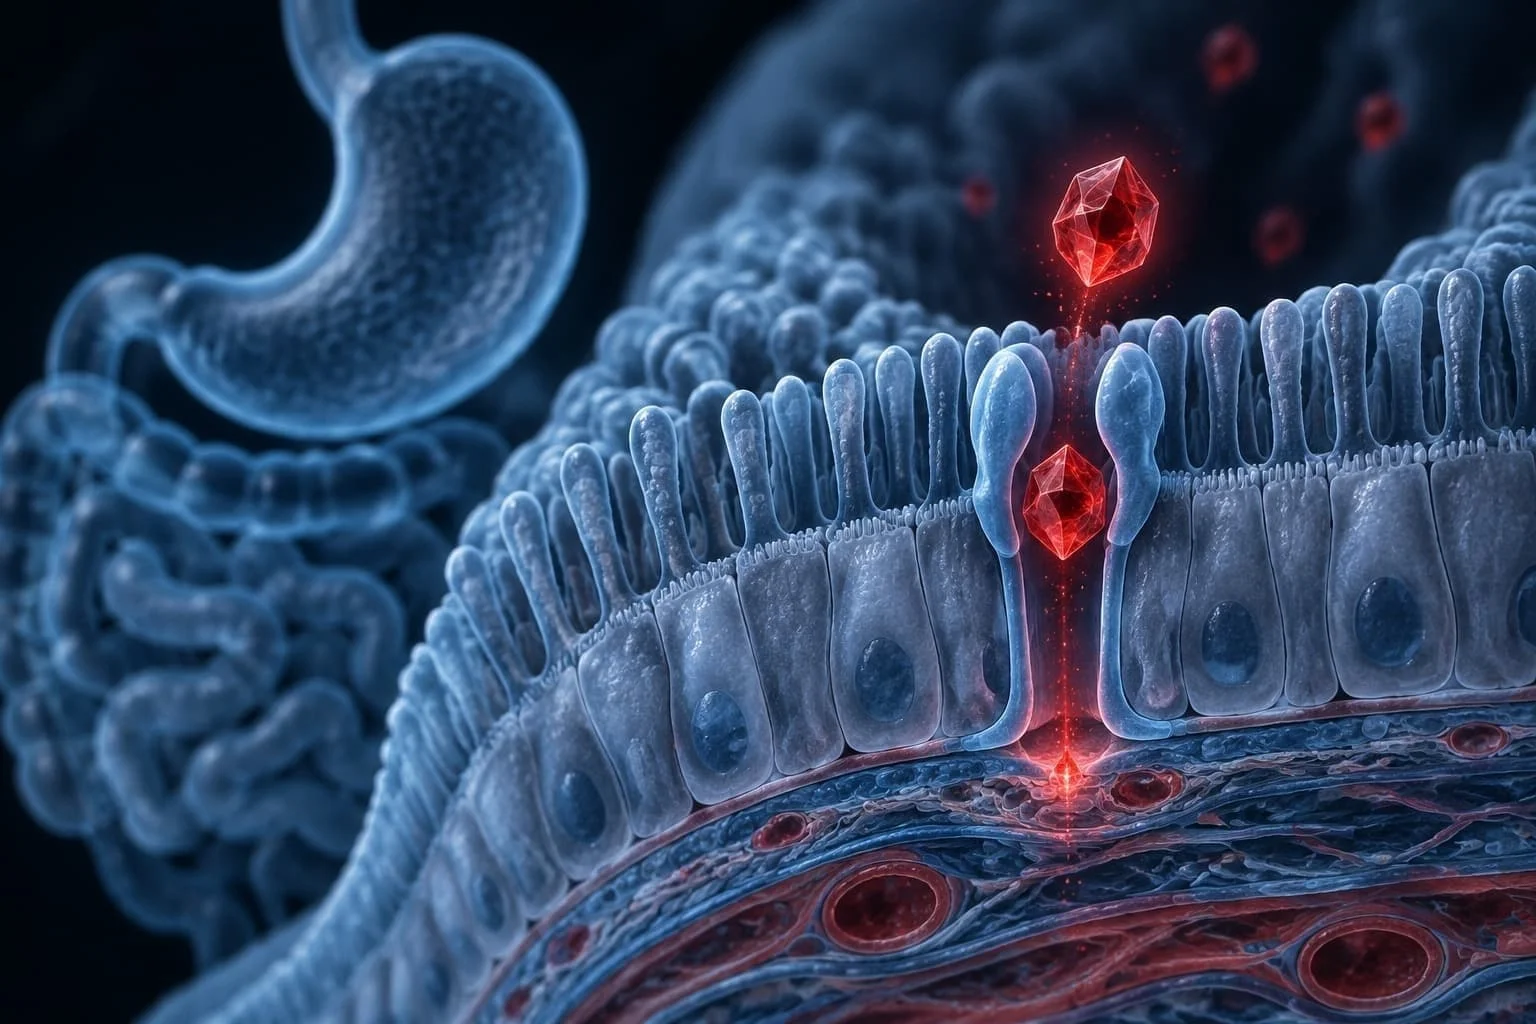
B12 is the only vitamin that needs a dedicated protein to be absorbed. It has to be freed from food protein in the stomach, bound to intrinsic factor made by the stomach lining, and taken up by a receptor in the lower small intestine. That machinery saturates at about 1.5 to 2 micrograms in a single meal, so the proportion absorbed falls as the amount in one meal rises; a small fraction crosses by passive diffusion regardless (Watanabe, 2007). Any step of that chain can fail independently of how much B12 is eaten.
Failure to release the vitamin from food protein, rather than classic malabsorption, is now described as the commonest mechanism behind subclinical deficiency, accounting for something like a third of cases; pernicious anaemia, in which antibodies disable intrinsic factor, is the classic autoimmune cause (Shipton & Thachil, 2015). Screening of 729 people aged 60 and over found undiagnosed and untreated pernicious anaemia in 1.9%, which the author extrapolated to nearly 800,000 older Americans, and most of those cases had only minimal clinical signs (Carmel, 1996).
Two features of this route explain why the deficiency is slow to appear and then slow to be believed. Stores in the liver are large in relation to what is lost, so a broken absorption step can run for years before anything is noticeable, which is also why the first complaint is often neurological rather than a sudden collapse in the blood count. And because the vitamin is carried in the blood on two different proteins, a measurement of the total says little about the part that reached the tissues (Nexo & Hoffmann-Lücke, 2011). The failure is in the delivery chain, not in the shopping.
Who is actually at risk
Two common medicines shift the odds measurably. In the long-term follow-up of a diabetes prevention trial, 19.1% of participants on metformin had low or borderline B12 at year five against 9.5% on placebo, with the risk rising by about a tenth for each year of use (Aroda et al., 2016). In a case-control study of 25,956 people with a new diagnosis of B12 deficiency, two or more years of proton pump inhibitor use carried an odds ratio of 1.65, with a modest gradient by amount taken (Lam et al., 2013). The second is an observational association, and people on these medicines are also tested more often.
Diet matters in a way that is easy to state backwards. In nearly 3,000 participants of a long-running cohort, 39% had plasma B12 below the upper study cut-off and 9% below the lowest, with almost no difference between age groups. Among those not taking supplements, people eating fortified breakfast cereals more than four times a week had fewer low values, as did dairy eaters, while meat intake showed no significant relationship (Tucker et al., 2000). Bioavailability explains part of it: measured absorption is 56% to 89% from lamb and 61% to 66% from chicken, but under 9% from eggs (Watanabe, 2007).
Diets that exclude animal foods sit in a different category, because plant foods carry no dependable source of the vitamin, with dried nori the main reported exception. Fortified products and, for vegetarians, dairy and eggs are what keeps intake going, which is why the type of source rather than the overall quality of the diet is the thing that separates people. One claim deserves naming: edible blue-green algae sold as a supply of B12 contain mostly an inactive analogue rather than the vitamin itself (Watanabe, 2007).
Why the standard test is argued about
Total serum B12 measures everything in circulation, but only the portion bound to transcobalamin is available to cells, and that is roughly a quarter of the total (Nexo & Hoffmann-Lücke, 2011). The consequence shows up in national data: using survey samples from more than 12,000 adults, moving the threshold shifted the prevalence estimate from 3% to 26% on serum B12, while the functional marker methylmalonic acid moved only from 2% to 6%. Low B12 with normal methylmalonic acid appeared in 2% of adults, disproportionately young women, which the authors read as probable false low readings (Bailey et al., 2011).
Laboratory practice reflects that uncertainty rather than resolving it. A 2025 review of the biomarkers records an indeterminate band in current British guidance rather than a single cut-off, notes that reference intervals differ between laboratories and between ethnic groups, and gives the example of two English laboratories whose lower limits sit well apart on different analytical platforms (Harrington et al., 2025). The same review notes falsely normal total B12 in patients with high titres of intrinsic factor antibodies, and a fall of about half in pregnancy from dilution alone.
The functional markers are better but not clean either. Methylmalonic acid rises in dehydration, in thyroid disorder, in bacterial overgrowth of the small intestine and with reduced kidney function, and its interpretation is harder in older patients for the same reason; homocysteine drifts upwards in a sample left standing at room temperature, by roughly one unit over three hours (Harrington et al., 2025). Sample handling can therefore affect the interpretation of homocysteine results.
The trade-off is quantified. At one threshold total B12 identified only 45% of deficient cases while almost never flagging healthy people; raised to a higher cut-off it caught 87% but misclassified many others (Harrington et al., 2025). There is no setting that is simply correct, which is why the figures for how many people are affected are themselves a choice. Estimates of subclinical deficiency across the general population run from 2.5% to 26% depending on the definition adopted (Green et al., 2017).
What the evidence supports and what it does not
Well supported: neurological manifestations of vitamin B12 deficiency can occur without anaemia or macrocytosis, as documented in several clinical series (Lindenbaum et al., 1988; Savage et al., 1994). Delayed diagnosis is associated with more severe neurological impairment and less complete recovery (Healton et al., 1991). The mechanisms of absorption and the consequences of impaired delivery are also described in clinical reviews (Shipton & Thachil, 2015).
Unsettled: where to draw the line. The thresholds that define deficiency are openly described as contested, the prevalence figures move by an order of magnitude with the definition, and the markers disagree with each other in both directions, with 5% of adults in the national data showing a raised functional marker and a normal B12 (Bailey et al., 2011; Green et al., 2017). Whether to screen anyone without symptoms has no settled answer, and the most recent national estimates for the United States still rest on survey rounds collected two decades ago.
Clinical series describe numbness or tingling in the feet, unsteadiness, and changes in memory or mood in patients with vitamin B12 deficiency, including those without anaemia. In one hospital series, a longer interval between symptom onset and treatment was associated with less complete neurological recovery (Healton et al., 1991). How storage and processing change another vitamin in food is measured in vitamin C in peas.
Frequently asked questions
Is vitamin B12 deficiency only a problem for older people?
Age raises the risk, but in a cohort of nearly 3,000 adults the proportion with low plasma values differed little between those in their thirties, their fifties and their seventies. Diet pattern, medicines and the state of the stomach lining separate people more sharply than age alone does. (Tucker et al., 2000).
What is pernicious anaemia?
An autoimmune condition in which antibodies disable intrinsic factor, the stomach protein that B12 needs in order to be absorbed. Screening of people aged 60 and over found it undiagnosed and untreated in about one in fifty, usually with only minimal signs at the time of detection. (Carmel, 1996).
Are eggs a good source of B12?
By measured absorption they are a poor one. Studies in healthy people put bioavailability under 9% from eggs, against 56% to 89% from lamb and 61% to 66% from chicken. The amount listed in a food table and the amount that reaches the blood are different quantities here. (Watanabe, 2007).
Does a vegetarian or vegan diet always cause deficiency?
Not automatically, because the vitamin also comes from dairy, eggs and fortified foods, and body stores are large relative to daily losses. Plant foods contain no reliable B12 of their own apart from dried nori, and some algae products supply an inactive analogue rather than the vitamin, so the source matters more than the total. (Watanabe, 2007).
Can symptoms be reversed once they appear?
Partly, and the odds depend on how long they lasted. In the episodes with adequate follow-up, 121 of 153, complete recovery followed in 47.1%, while 6.3% were left with moderate or severe disability, and the degree of improvement was worse in patients whose blood count had stayed normal and whose diagnosis therefore came later. (Healton et al., 1991).
Sources
- Andrès E, Affenberger S, Vinzio S, et al. Food-cobalamin malabsorption in elderly patients: clinical manifestations and treatment. American Journal of Medicine. 2005;118(10):1154–1159. DOI 10.1016/j.amjmed.2005.02.026.
- Aroda VR, Edelstein SL, Goldberg RB, et al. Long-term metformin use and vitamin B12 deficiency in the Diabetes Prevention Program Outcomes Study. Journal of Clinical Endocrinology and Metabolism. 2016;101(4):1754–1761. DOI 10.1210/jc.2015-3754.
- Bailey RL, Carmel R, Green R, et al. Monitoring of vitamin B-12 nutritional status in the United States by using plasma methylmalonic acid and serum vitamin B-12. American Journal of Clinical Nutrition. 2011;94(2):552–561. DOI 10.3945/ajcn.111.015222.
- Carmel R. Prevalence of undiagnosed pernicious anemia in the elderly. Archives of Internal Medicine. 1996;156(10):1097–1100. DOI 10.1001/archinte.1996.00040041097008. PMID 8638997.
- Green R, Allen LH, Bjørke-Monsen AL, et al. Vitamin B12 deficiency. Nature Reviews Disease Primers. 2017;3:17040. DOI 10.1038/nrdp.2017.40.
- Harrington DJ, Stevenson E, Sobczyńska-Malefora A. The application and interpretation of laboratory biomarkers for the evaluation of vitamin B12 status. Annals of Clinical Biochemistry. 2025;62(1):22–33. DOI 10.1177/00045632241292432.
- Healton EB, Savage DG, Brust JC, Garrett TJ, Lindenbaum J. Neurologic aspects of cobalamin deficiency. Medicine (Baltimore). 1991;70(4):229–245. DOI 10.1097/00005792-199107000-00001.
- Lam JR, Schneider JL, Zhao W, Corley DA. Proton pump inhibitor and histamine 2 receptor antagonist use and vitamin B12 deficiency. JAMA. 2013;310(22):2435–2442. DOI 10.1001/jama.2013.280490.
- Lindenbaum J, Healton EB, Savage DG, et al. Neuropsychiatric disorders caused by cobalamin deficiency in the absence of anemia or macrocytosis. The New England Journal of Medicine. 1988;318(26):1720–1728. DOI 10.1056/NEJM198806303182604.
- Morris BM, Thain A, Schweiger BC, et al. Patient-reported symptom profiles in vitamin B12 deficiency and pernicious anemia: a cross-sectional study using latent class analysis. Frontiers in Medicine. 2026;13:1927721. DOI 10.3389/fmed.2026.1927721.
- Nexo E, Hoffmann-Lücke E. Holotranscobalamin, a marker of vitamin B-12 status: analytical aspects and clinical utility. American Journal of Clinical Nutrition. 2011;94(1):359S–365S. DOI 10.3945/ajcn.111.013458.
- Savage DG, Lindenbaum J, Stabler SP, Allen RH. Sensitivity of serum methylmalonic acid and total homocysteine determinations for diagnosing cobalamin and folate deficiencies. American Journal of Medicine. 1994;96(3):239–246. DOI 10.1016/0002-9343(94)90149-x.
- Shipton MJ, Thachil J. Vitamin B12 deficiency: a 21st century perspective. Clinical Medicine (London). 2015;15(2):145–150. DOI 10.7861/clinmedicine.15-2-145.
- Tucker KL, Rich S, Rosenberg I, et al. Plasma vitamin B-12 concentrations relate to intake source in the Framingham Offspring study. American Journal of Clinical Nutrition. 2000;71(2):514–522. DOI 10.1093/ajcn/71.2.514.
- Watanabe F. Vitamin B12 sources and bioavailability. Experimental Biology and Medicine. 2007;232(10):1266–1274. DOI 10.3181/0703-MR-67.

Elias R. Westbrook — author
Elias R. Westbrook is academic background in human nutrition and nutritional sciences, with a focus on food composition, nutrient intake, dietary patterns, and the relationship between foods and nutritional health. For Cabdirect, this persona is intended to co...
This article is for general information and is not medical advice. It was reviewed for accuracy by a qualified clinician; decisions about your health should be made with your own doctor.
Related

Mainly fruit diet study: biochemical effects in 1971

Vitamin C in Peas: Effects of Shipping, Freezing and Canning
Dietary Iron and Hair Growth - Cunningham’s 1932 Rat Study

What potassium does for the body, from heartbeat to blood pressure

Vitamin K deficiency and why newborns get a vitamin K shot at birth

What research shows about whether creatine is bad for your kidneys

Magnesium for anxiety and what the clinical trials actually found