



Tackling Climate Change Through Livestock: Emissions and Mitigation
The 2013 FAO report Tackling climate change through livestock assessed greenhouse gas emissions across global livestock supply chains and examined where practical reductions could be achieved. Using life cycle assessment, statistical analysis, scenario building and the Global Livestock Environmental Assessment Model (GLEAM), the authors estimated both the scale of emissions and the differences among species, production systems and regions.
The report estimated livestock supply-chain emissions at 7.1 gigatonnes of CO2-equivalent per year, equal to 14.5% of human-induced greenhouse gas emissions under its accounting framework. Its central message was not only that livestock was a significant source of emissions, but that substantial reductions were technically possible through wider adoption of existing practices and technologies.
Why FAO Assessed the Entire Livestock Supply Chain
The boundaries of a supply-chain assessment matter because the same livestock product may involve emissions on farms, in feed-growing regions and during later handling. Looking across those stages helps avoid concentrating on visible farm activities while overlooking upstream sources. It also makes comparisons more useful when different systems rely on purchased feed, grazing or distinct manure-management arrangements.
The report was designed to move beyond a single source of farm emissions. Its life cycle perspective followed emissions through feed production, animal production, manure handling, processing and transport, allowing the authors to compare pathways that would otherwise be separated in conventional inventories.
This supply-chain framing was important because livestock systems are highly diverse. Species, feed sources, production intensity, climate, manure practices and land-use patterns can all change the amount and composition of greenhouse gases associated with a unit of livestock output.
FAO used GLEAM to represent livestock production systems spatially and to connect herd, feed, manure and production information with emission factors. The resulting assessment was a global modelling exercise intended to identify major sources, differences in emission intensity and areas where technical improvements could reduce emissions.
How Large Livestock Emissions Were in the 2013 Assessment
These figures describe the distribution of emissions under the methods and reference conditions used in the 2013 assessment. They should not be read as fixed shares that apply to every country or year. Production volumes, herd composition, feed sourcing and the treatment of land-use change can alter the resulting balance.
FAO estimated total emissions from global livestock supply chains at 7.1 gigatonnes of CO2-equivalent per year. Within the report framework, this represented 14.5% of all human-induced greenhouse gas emissions. The total combined methane, nitrous oxide and carbon dioxide sources occurring along the supply chain.
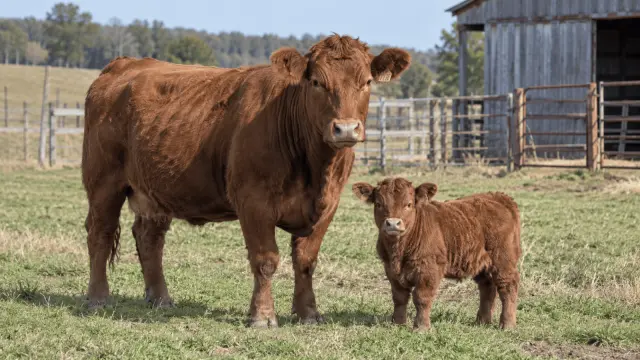
Cattle were the largest species-level contributor, accounting for about 65% of livestock-sector emissions, or roughly 4.6 gigatonnes CO2-equivalent. Beef production alone was assigned 2.9 gigatonnes, or 41% of sector emissions, while cattle milk accounted for 1.4 gigatonnes, or 20%.
Table 1. Global Livestock Emissions Reported in the 2013 FAO Assessment
Measure | FAO estimate | Context |
Total livestock supply-chain emissions | 7.1 Gt CO2-eq/year | 14.5% of human-induced GHG emissions |
Cattle | 4.6 Gt CO2-eq | About 65% of livestock-sector emissions |
Beef | 2.9 Gt CO2-eq | 41% of sector emissions |
Cattle milk | 1.4 Gt CO2-eq | 20% of sector emissions |
Where Greenhouse Gas Emissions Enter Livestock Supply Chains
The pathways also differ in the gases they produce. Methane is closely associated with ruminant digestion and some manure systems, while nitrous oxide can arise from nitrogen cycling in soils and manure. Carbon dioxide is linked to energy use and some land-use changes. Consequently, a measure that addresses one pathway may leave other important sources largely unchanged. Land-use effects can be particularly sensitive to how boundaries and time periods are defined. Similarly, emissions associated with purchased feed may occur far from the location where animals are raised. Following these connections through the supply chain allows mitigation planning to consider the full production process instead of shifting emissions from one stage to another.
Feed production, processing and transport accounted for about 45% of sector emissions in the report. This category included emissions from fertilizer use, manure deposited on pasture, energy used to produce and transport feed, and land-use change associated with expansion of pasture and feed crops.
Enteric fermentation was another major pathway, especially for ruminants. Manure storage and processing can generate methane and nitrous oxide, while energy consumption occurs throughout supply chains, including fertilizer manufacture, machinery, buildings, processing and transport.
Why Cattle Dominated the Livestock Greenhouse Gas Inventory
Cattle emissions arise from both biological processes and the resources required to maintain herds. Ruminant digestion produces methane, while growing feed, maintaining pasture and managing manure add other sources. Production efficiency also affects how emissions are distributed across meat and milk outputs. As a result, the same broad livestock category can contain farms with very different emission profiles. This variability is one reason the assessment focused on improvement opportunities within comparable systems rather than assuming that one measure would work equally well everywhere.
Cattle combined several high-emission pathways: enteric methane, feed production, manure and, in some regions, land-use change. The report estimated cattle at about 4.6 gigatonnes CO2-equivalent, making them the dominant species group in the livestock inventory.
The report stressed that average global totals should not be interpreted as if all producers had the same performance. Regional differences in productivity, feed digestibility, reproduction, mortality and herd structure could create large gaps in emissions per unit of product.
Table 2. Major Emission Pathways Identified Across Livestock Supply Chains
Pathway | Main greenhouse gases or sources | Role in the report |
Feed production | CO2 and N2O; land-use change; fertilizer and energy | About 45% when production, processing and transport are combined |
Enteric fermentation | CH4 from ruminant digestion | Major source for cattle, buffalo, sheep and goats |
Manure management | CH4 and N2O from storage and processing | Importance varies with manure system and climate |
Energy use | CO2 from fossil-fuel consumption | About 20% when energy use is aggregated along supply chains |
How FAO Estimated the Scope for Livestock Emission Reductions
The potential estimate is best understood as a comparison between current practices and better-performing approaches within similar production conditions. Improving animal health or feed conversion can reduce emissions per unit of output, while changes in manure storage can directly affect methane releases. The feasibility of each measure depends on the farm system and available resources. The estimate highlights potential improvements rather than a fixed reduction timetable. Whether improvements can be achieved depends on management, access to technology and the trade-offs involved in each production setting. It is therefore important to distinguish modelled technical potential from reductions already achieved in practice.
The report estimated that livestock-sector emissions could be reduced by approximately 30%, or about 1.8 gigatonnes CO2-equivalent, within existing production systems if producers adopted practices associated with lower emission intensities. The estimate was based on closing performance gaps within comparable systems rather than assuming a complete redesign of global livestock production.
Improved feed quality, animal health, husbandry, breeding, manure management, energy efficiency and grazing management appeared repeatedly in the report. The authors did not present the 30% figure as an automatic outcome because adoption depends on costs, incentives, knowledge, institutions and local production conditions.
What the Regional Case Studies Added to the Global Estimate
The case studies demonstrated that mitigation packages must reflect the production context. A measure suited to specialized beef production may not be equally relevant to a small-ruminant system or an intensive pig operation. Different baseline practices, feed resources and animal-health constraints help explain why estimated reductions varied across the examples. The ranges also represent modelled outcomes for selected combinations of measures. They are useful for comparing possibilities, but they do not establish that every producer in a named region could achieve the same percentage reduction.
FAO tested packages of mitigation practices in five case studies: dairy cattle in South Asia, intensive pig production in East and Southeast Asia, specialized beef in South America, small ruminants in West Africa and dairy production in OECD countries. Estimated mitigation potentials differed substantially across these systems.
In specialized South American beef production, selected improvements were estimated to reduce baseline emissions by 19% to 30%. West African small-ruminant packages were estimated at 27% to 41%, while OECD mixed dairy systems were estimated at 14% to 17%.
Table 3. Examples of Mitigation Potential in FAO Case Studies
Production system | Region | Estimated reduction from selected measures |
Specialized beef | South America | 19–30% of baseline emissions |
Small ruminants | West Africa | 27–41% of baseline emissions |
Mixed dairy | OECD countries | 14–17% of baseline emissions |
Five case studies overall | Multiple regions and species | 14–41% across the selected systems |
Why Emission Intensity Matters Alongside Total Emissions
For climate policy, both measures are therefore necessary. Emission intensity helps identify inefficient processes and opportunities for improvement, whereas absolute emissions indicate the sector’s overall contribution to atmospheric greenhouse gases. Monitoring only one of these measures can conceal changes in the other.
Emission intensity expresses greenhouse gas emissions relative to an output such as meat, milk, eggs or edible protein. It allowed the report to compare production units that differed greatly in scale and productivity.
The report distinguished efficiency gains from changes in total production. A system can become less emission-intensive per kilogram of product while total emissions still rise if production expands enough, so lower intensity does not automatically mean lower global emissions.
What the Report Recommended for Policy and Collective Action
The assessment therefore linked technical options with the conditions needed to put them into practice. Access to extension services, suitable finance, reliable information and locally appropriate incentives can influence whether farmers can adopt improved feeding, breeding or manure-handling methods. Policies also need to account for the importance of livestock to household livelihoods and food supply. Implementation also involves measuring results over time. Changes in feeding or manure management can influence several emission sources simultaneously, so evaluating their overall effects requires consistent accounting. Coordination among producers, advisers and public agencies helps connect practical farm decisions with broader climate objectives.
The final chapters argued that mitigation requires more than identifying technically effective practices. Policies need to address barriers to adoption, create incentives, improve information and support investment in practices suited to specific regions and production systems.
FAO placed climate mitigation within the wider role of livestock in food, nutrition, income and rural livelihoods. Its overall position was that meaningful reductions were technically within reach, but implementation required coordinated action across producers, industry, researchers and governments.
The Continuing Relevance of Livestock Emissions Research
The 2013 assessment remains useful for explaining how the sector can be examined as a connected system rather than a collection of isolated farm emissions. Its emphasis on differences among species and production methods continues to inform how mitigation options are discussed. At the same time, changes in livestock populations, productivity, energy systems and scientific methods mean that historical percentages require careful interpretation. Comparisons with later estimates should account for differences in system boundaries and modelling assumptions before treating a change in the headline number as a real-world trend.
The report remains an influential historical global assessment, but its headline values belong to a specific 2013 modelling framework, data set and set of global-warming assumptions. These figures represent historical model-based estimates rather than current measurements of global livestock emissions.
The report established a supply-chain approach to assessing livestock emissions, distinguishing sources, species and production systems while identifying opportunities for targeted mitigation. More recent emission inventories and updated research provide additional context for assessing livestock-related climate impacts today.
Practical takeaway: The 2013 FAO assessment estimated that livestock supply chains emitted 7.1 gigatonnes CO2-equivalent per year and argued that roughly 30% of sector emissions could be reduced within existing production systems through wider use of available practices. Its most important lesson is that mitigation must target the dominant sources in each system — feed, enteric methane, manure, energy or land use — rather than applying one universal solution.
Frequently asked questions
How much greenhouse gas did the report attribute to livestock?
The 2013 FAO assessment estimated livestock supply-chain emissions at 7.1 gigatonnes of CO2-equivalent annually. Under its life-cycle accounting framework, that was 14.5% of human-induced greenhouse gas emissions. The estimate included emissions associated with feed, animals and other supply-chain activities, and it should not be mistaken for a current global measurement.
Which livestock species contributed the most emissions?
Cattle were the largest contributor in the 2013 FAO assessment, accounting for approximately 4.6 gigatonnes of CO2-equivalent, or about 65% of livestock-sector emissions. Beef production represented 41% of the sector total, and cattle milk represented 20%. These figures reflect the report’s global modelling framework rather than identical patterns on individual farms.
What was the largest broad source of livestock emissions?
Feed production, processing and transport together accounted for approximately 45% of livestock supply-chain emissions in the FAO assessment. The category covered sources including fertilizer, energy use, manure deposited on pasture and land-use change. Enteric fermentation was another major pathway, especially for cattle and other ruminants that produce methane during digestion.
How much could livestock emissions be reduced according to FAO?
FAO estimated that livestock emissions could be reduced by approximately 30%, equivalent to around 1.8 gigatonnes of CO2-equivalent, within existing production systems. This technical potential depended on wider adoption of better-performing practices involving feed, animal health, husbandry and manure. It was not a forecast of reductions that would happen automatically.
Sources
- Gerber PJ, Steinfeld H, Henderson B, Mottet A, Opio C, Dijkman J, Falcucci A, Tempio G. Tackling Climate Change Through Livestock: A Global Assessment of Emissions and Mitigation Opportunities. FAO; 2013.
- Gerber PJ, Henderson B, Makkar HPS, editors. Mitigation of Greenhouse Gas Emissions in Livestock Production: A Review of Technical Options for Non-CO2 Emissions. FAO Animal Production and Health Paper No. 177; 2013.
- Gerber PJ, Hristov AN, Henderson B, et al. Technical options for the mitigation of direct methane and nitrous oxide emissions from livestock: a review. Animal. 2013;7(S2):220–234.
- Hristov AN, Oh J, Firkins JL, et al. Special topics—mitigation of methane and nitrous oxide emissions from animal operations: I. A review of enteric methane mitigation options. Journal of Animal Science. 2013;91(11):5045–5069.
- Beauchemin KA, Ungerfeld EM, Eckard RJ, Wang M. Review: Fifty years of research on rumen methanogenesis: lessons learned and future challenges for mitigation. Animal. 2020;14(S1):s2–s16.
- Arndt C, Hristov AN, Price WJ, et al. Full adoption of the most effective strategies to mitigate methane emissions by ruminants can help meet the 1.5°C target by 2030 but not 2050. PNAS. 2022;119(20):e2111294119.
- MacLeod M, Gerber P, Mottet A, et al. Greenhouse gas emissions from pig and chicken supply chains: A global life cycle assessment. FAO; 2013.
- Opio C, Gerber P, Mottet A, et al. Greenhouse gas emissions from ruminant supply chains: A global life cycle assessment. FAO; 2013.
- Gill M, Smith P, Wilkinson JM. Mitigating climate change: the role of domestic livestock. Animal. 2010;4(3):323–333.

Adrian Foster — author
Adrian Foster writes with an editorial focus on experimental science, laboratory research, controlled comparisons, measurement techniques and the role of replication in evaluating scientific findings. At CAB Direct, Adrian covers experiments, laboratory method...
Related

Travel in Later Life: What an Eight-Person Study Found

Adult Literacy Classes in Kenya: What a 1980s Study Found

China cruise tourism: growth and changing passenger behaviour

Tradition, Modernity and Tourism in Swaziland: Social Effects

Sydney and Melbourne: Divergent Sporting Cultures

Betalain-Rich Red Beet Extract and Osteoarthritis Discomfort