

Livestock and Climate Change: Why Emission Estimates Differ
Livestock is a major source of human-caused greenhouse gas emissions, but the size of its global share depends heavily on what is counted and how emissions are converted into carbon-dioxide equivalents. Goodland and Anhang's 2009 World Watch article argued for a figure of at least 51%, far above mainstream inventory estimates; later peer-reviewed criticism identified major methodological differences behind that result.
The comparison centres on the 51% claim, the FAO estimates that preceded and followed it, and the roles of methane, manure, feed, land-use change and supply chains. It distinguishes direct emissions from opportunity-cost arguments about land and explains why modern assessments use explicit system boundaries rather than treating every plausible climate effect as the same accounting category.
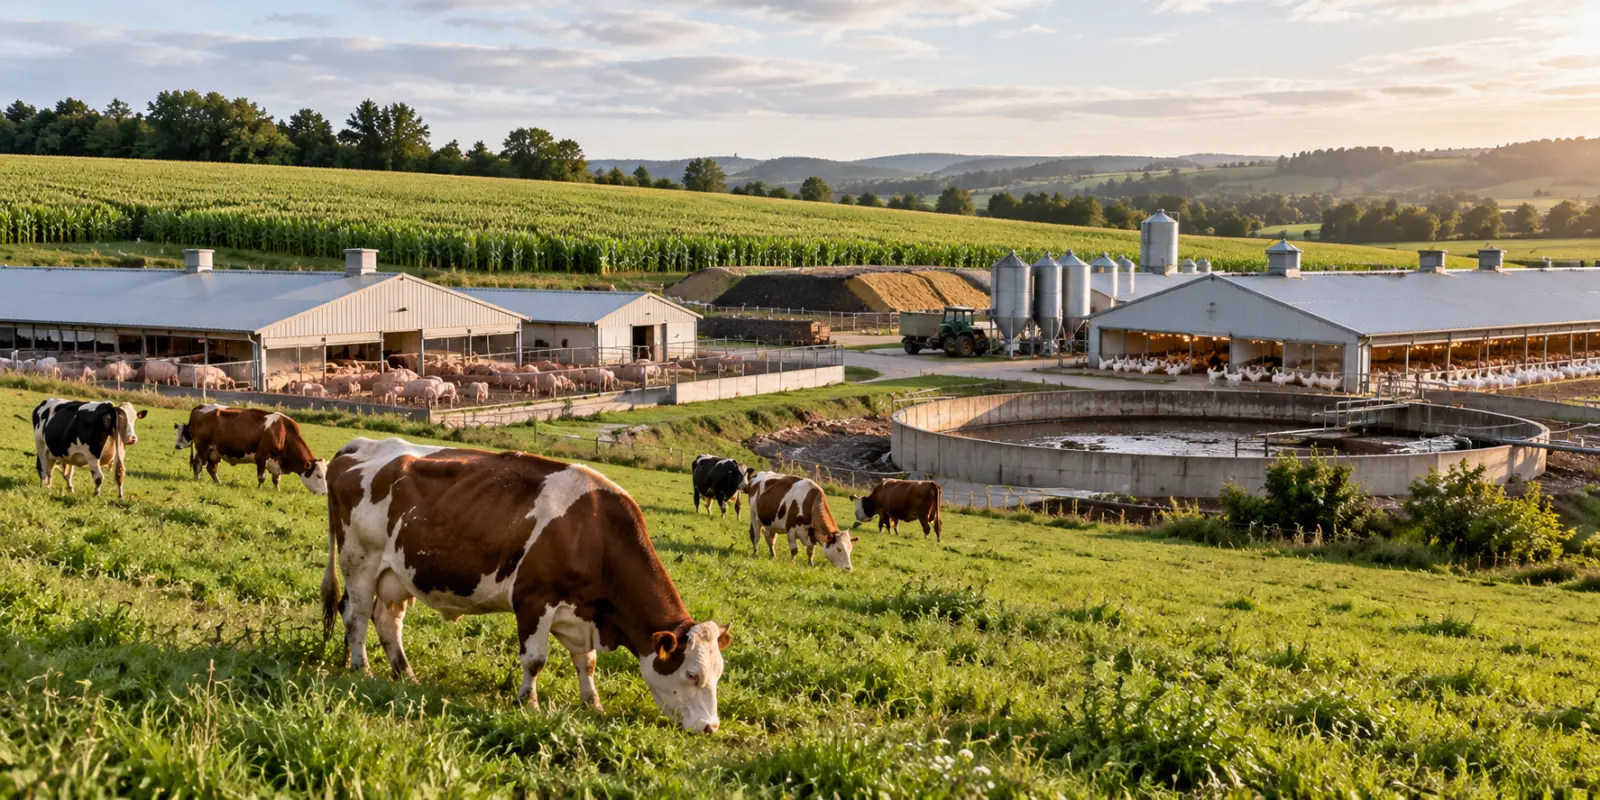
The 2009 paper challenged the prevailing livestock estimate
Goodland and Anhang published their analysis in World Watch magazine in 2009, using FAO's 2006 Livestock's Long Shadow estimate as their starting point. They argued that livestock and its byproducts should be assigned at least 32.564 billion tonnes of carbon-dioxide equivalent per year, which they calculated as 51% of worldwide anthropogenic greenhouse gas emissions.
The article was deliberately broader than a conventional livestock life-cycle inventory. It added categories the authors considered overlooked or misallocated, including livestock respiration, additional land-use effects, a larger methane weighting, higher livestock numbers and several supply-chain or byproduct categories.
Why the 51% figure is so much higher
The largest difference came from accounting choices rather than a new direct measurement of farms. Goodland and Anhang added 8.769 Gt CO2e for livestock respiration, 2.672 Gt or more for what they described as overlooked land use, and 5.047 Gt from applying a 20-year methane global-warming potential instead of the longer time horizon used in the FAO comparison.
They also added other categories they believed had been undercounted and reassigned emissions that conventional inventories place in other sectors. Because these additions change both the numerator and the accounting boundary, their 51% is not directly comparable with a standard sectoral estimate built under IPCC-style greenhouse gas inventory conventions.
The gap between 12%, 14.5%, 18% and 51% is primarily a question of accounting boundaries and climate metrics, not four measurements of the same quantity.
Livestock respiration is a central methodological disagreement
Goodland and Anhang counted carbon dioxide exhaled by livestock as an additional anthropogenic emission. Their argument was that a smaller livestock population could free land for vegetation and therefore increase carbon uptake.
Mainstream greenhouse gas inventories do not treat animal respiration as a net anthropogenic CO2 source. The carbon in exhaled CO2 comes largely from recently grown plant material that removed CO2 from the atmosphere during photosynthesis. Herrero and colleagues argued in 2011 that counting this short-cycle biogenic CO2 alongside fossil carbon creates a methodological inconsistency.
Land-use change and land opportunity cost are related but different
Livestock can drive real carbon emissions when forests or other carbon-rich ecosystems are cleared for pasture or feed production. Those land-use-change emissions are included in major life-cycle assessments when they can be attributed to livestock supply chains.
Goodland and Anhang went further by assigning climate value to carbon sequestration that could potentially occur if land now used for grazing or feed were allowed to regenerate. That is an opportunity-cost or counterfactual calculation. It can be relevant to mitigation analysis, but it is conceptually different from recording an actual annual emission in a national greenhouse gas inventory.
Methane changes the picture because the time horizon matters
Ruminants produce methane mainly through enteric fermentation, while manure can also generate methane under anaerobic conditions. Methane is much more effective than CO2 at trapping heat per unit mass but remains in the atmosphere for a much shorter time.
Goodland and Anhang used a 20-year global-warming-potential value for methane, which places more weight on near-term warming than a 100-year metric. That choice substantially increased the CO2-equivalent assigned to livestock methane. Both time horizons describe real physical effects, but comparisons must use the same metric throughout or the totals become inconsistent.
Metric choice is not the same as discovering extra methane
Changing from a 100-year to a 20-year GWP does not mean that more methane molecules were emitted. It changes the weighting applied when methane is converted into a common CO2-equivalent unit. That is why a transparent assessment should report the metric and time horizon rather than presenting a CO2e total as if it were independent of methodological choices.
FAO's 2006 estimate used a broad life-cycle boundary
Livestock's Long Shadow estimated that livestock accounted for about 18% of anthropogenic greenhouse gas emissions under the methods and data then available. The report included more than emissions produced directly by animals: it also considered feed production, land-use change, manure, processing and other parts of the livestock chain.
This matters because the later debate was sometimes framed as if the FAO estimate counted only farm emissions. It did not. The disagreement was over how far the boundary should extend, how land-related effects should be attributed and how different gases should be converted and compared.
Peer-reviewed criticism focused on comparability and international protocols
In 2011, Herrero and 13 co-authors addressed the range of global livestock estimates, which by then stretched from single-digit percentages to 51%. They argued that the highest estimates departed from internationally used methods by counting respired CO2 and applying different methane assumptions, making the resulting total difficult to compare with standard global inventories.
Their paper did not argue that livestock emissions were negligible. Instead, it stressed that credible estimates require consistent definitions of system boundaries, carbon cycles, land-use change and greenhouse gas metrics.
FAO later revised its own global estimates
FAO's 2013 assessment estimated livestock supply-chain emissions at 7.1 Gt CO2e per year, equal to about 14.5% of human-caused greenhouse gas emissions under its reference assumptions. The main sources were feed production and processing, land-use change, enteric fermentation and manure management.
A newer FAO assessment published in 2023 used a 2015 baseline and the updated Global Livestock Environmental Assessment Model. It estimated livestock agrifood systems at 6.2 Gt CO2e, around 12% of anthropogenic emissions and roughly 40% of emissions from agrifood systems.
Current estimates identify cattle as the dominant source
FAO's 2023 assessment attributes about 62% of livestock agrifood-system emissions to cattle. Pigs account for about 14%, chickens about 9%, buffaloes about 8% and small ruminants about 7% under the 2015 baseline.
The species differences reflect biology and production systems. Ruminants generate substantial methane through enteric fermentation, while pigs and poultry do not produce comparable enteric methane but still contribute through feed production, manure, energy use and supply-chain processes.
What each estimate is actually counting
Assessment | Headline estimate | Important boundary choices | How to interpret it |
FAO, 2006 | 18% of anthropogenic GHG emissions | Broad livestock life cycle including land-use change and feed | Historical global estimate using methods and data available at the time |
Goodland & Anhang, 2009 | At least 51% | Adds respiration, land opportunity effects, 20-year methane weighting and reassigned categories | Alternative accounting framework; not directly comparable with standard inventories |
FAO, 2013 | 7.1 Gt CO2e; 14.5% | Livestock supply chains, land-use change, feed, animals, manure and processing | Updated life-cycle assessment using GLEAM |
FAO, 2023 | 6.2 Gt CO2e; about 12% | Livestock agrifood systems, reference year 2015 | Current FAO baseline for mitigation pathways |
IPCC assessments | No single livestock percentage headline | Separates gases and AFOLU sources within global inventory frameworks | Useful for comparing agricultural methane and nitrous oxide consistently across sectors |
Enteric methane remains a major physical source regardless of the accounting debate
IPCC assessments identify enteric fermentation as the dominant agricultural methane source associated with livestock. Methane production is especially important in cattle, buffaloes, sheep and goats because microbes in the rumen break down fibrous feed.
This is a physical emission source, not an accounting convention. The debate concerns how methane is expressed in CO2-equivalent terms and how livestock totals are compared with other sectors, not whether ruminant methane exists.
Manure contributes methane and nitrous oxide
Stored manure can emit methane when decomposition occurs without oxygen, while manure handling and nitrogen cycling can generate nitrous oxide directly or indirectly. Emissions depend strongly on climate, storage system, treatment, diet and how manure is applied to soils.
That variation creates mitigation opportunities. Improved manure storage, anaerobic digestion where appropriate, better nitrogen management and changes in housing or treatment can reduce emissions in some systems, although the practical benefit depends on local conditions.
Feed production links livestock to cropland and land-use change
Livestock emissions also arise before feed reaches an animal. Fertiliser manufacture and use, crop production, energy, transport and land-use change can all contribute to the footprint of feed.
This is one reason production systems differ substantially. A grazing animal on land unsuitable for crops, an intensive dairy herd fed high-quality crops and a pig or poultry system dependent on traded feed ingredients have different emission profiles and different options for reduction.
Food-system studies confirm that animal products often have high footprints
Poore and Nemecek's 2018 global analysis compiled data from 38,700 farms and found very large variation in environmental impacts among producers of the same food. Even with that variation, ruminant meat generally had high greenhouse gas and land-use burdens compared with many plant foods.
The study also showed why averages can hide important differences. Producer practices, geography, feed conversion, land use and productivity all affect the footprint. Mitigation therefore includes both changes within livestock production and, in some contexts, changes in consumption patterns.
Mitigation can target both emissions intensity and total emissions
Improving animal health, reproductive performance, feed quality and productivity can reduce emissions per unit of milk, meat or eggs. Feed additives, breeding and manure technologies can also reduce particular gases in appropriate systems.
But lower emissions intensity does not automatically guarantee lower total emissions if production grows faster than efficiency improves. FAO's 2023 report therefore considers both supply-side efficiency and broader pathways that influence demand, production volume and land use.
Why one headline percentage cannot describe every livestock-climate question
A global percentage is useful for scale, but it cannot answer all policy or farm-management questions. The relevant number depends on whether the analysis is asking about direct farm emissions, full supply chains, land-use change, opportunity costs of land, near-term methane warming or long-term cumulative climate effects.
The 2009 World Watch paper remains important because it forced attention onto boundaries that can be overlooked. Its 51% estimate, however, should be presented as a contested alternative accounting approach rather than as the current scientific consensus for livestock's share of global emissions.
When comparing livestock-emission estimates, check:
- the reference year and total global emissions used as the denominator;
- whether the boundary includes feed, processing, transport and land-use change;
- whether biogenic respiration is counted as a separate net CO2 source;
- which methane metric and time horizon are used to calculate CO2-equivalent emissions;
- whether potential carbon sequestration on alternative land uses is recorded as an emission, a mitigation opportunity or a separate counterfactual.
Taken together, these differences explain why livestock's climate impact cannot be reduced to a single universal percentage. The most useful comparisons are those that make their system boundaries, reference years and greenhouse-gas metrics explicit. Goodland and Anhang's 2009 estimate remains historically important because it highlighted disputed accounting choices, while current assessments rely on more standardised frameworks and updated data.
Frequently asked questions
Did the 2009 World Watch paper really estimate livestock at 51% of global emissions?
Yes. Goodland and Anhang estimated that livestock and its byproducts accounted for at least 51% of anthropogenic greenhouse gas emissions. The result came from a broader accounting framework that added livestock respiration, land-related counterfactuals, a 20-year methane weighting and categories they believed standard inventories had missed or allocated elsewhere.
Why is the current FAO estimate much lower than 51%?
FAO uses life-cycle and inventory methods that do not count livestock respiration as a net anthropogenic CO2 source and apply consistent greenhouse gas accounting boundaries. Its 2023 assessment estimated livestock agrifood systems at 6.2 Gt CO2e in 2015, equal to around 12% of total human-caused emissions.
Does choosing a 20-year methane metric make livestock emissions wrong or right?
Neither. A 20-year methane GWP gives greater weight to near-term warming, while a 100-year metric spreads the comparison over a longer horizon. Both describe different policy-relevant aspects of methane. Problems arise when different time horizons are mixed inconsistently or when totals are compared without stating which metric was used.
What are the main greenhouse gases from livestock production?
Methane from enteric fermentation is a major source, especially from cattle and other ruminants. Manure can emit methane and nitrous oxide, while feed production, fertiliser use, energy and land-use change contribute additional CO2 and nitrous oxide. The relative importance varies by species, production system and region.
Can livestock emissions be reduced without eliminating livestock production?
Yes. FAO and other assessments identify options including improved animal health, feed quality, breeding, manure management, energy efficiency and targeted methane-reduction technologies. These measures can lower emissions intensity and sometimes absolute emissions, although total climate outcomes also depend on production volume, demand and land-use change.
Sources
- Goodland R, Anhang J. Livestock and climate change: what if the key actors in climate change are... cows, pigs, and chickens? World Watch. 2009;22(6):10-19.
- Steinfeld H, Gerber P, Wassenaar T, Castel V, Rosales M, de Haan C. Livestock's Long Shadow: Environmental Issues and Options. Rome: Food and Agriculture Organization of the United Nations; 2006. ISBN 978-92-5-105571-7.
- Herrero M, Gerber P, Vellinga T, et al. Livestock and greenhouse gas emissions: The importance of getting the numbers right. Animal Feed Science and Technology. 2011;166-167:779-782. DOI: 10.1016/j.anifeedsci.2011.04.083.
- Gerber PJ, Steinfeld H, Henderson B, et al. Tackling Climate Change Through Livestock: A Global Assessment of Emissions and Mitigation Opportunities. Rome: Food and Agriculture Organization of the United Nations; 2013. ISBN 978-92-5-107920-1.
- Food and Agriculture Organization of the United Nations. Pathways Towards Lower Emissions: A Global Assessment of the Greenhouse Gas Emissions and Mitigation Options from Livestock Agrifood Systems. Rome: FAO; 2023.
- Intergovernmental Panel on Climate Change. Climate Change 2021: The Physical Science Basis. Working Group I contribution to the Sixth Assessment Report. Chapter 5: Global Carbon and Other Biogeochemical Cycles and Feedbacks. Cambridge University Press; 2021.
- Intergovernmental Panel on Climate Change. Climate Change 2022: Mitigation of Climate Change. Working Group III contribution to the Sixth Assessment Report. Chapter 7: Agriculture, Forestry and Other Land Uses. Cambridge University Press; 2022.
- Poore J, Nemecek T. Reducing food's environmental impacts through producers and consumers. Science. 2018;360(6392):987-992. DOI: 10.1126/science.aaq0216.
- Mottet A, de Haan C, Falcucci A, Tempio G, Opio C, Gerber P. Livestock: On our plates or eating at our table? A new analysis of the feed/food debate. Global Food Security. 2017;14:1-8. DOI: 10.1016/j.gfs.2017.01.001.
- Clark MA, Domingo NGG, Colgan K, et al. Global food system emissions could preclude achieving the 1.5° and 2°C climate change targets. Science. 2020;370(6517):705-708. DOI: 10.1126/science.aba7357.

Maya Ellison — author
Maya Ellison is an environmental science writer for CAB Direct's Environment & Climate section. She holds an MSc in Environmental Science and a BSc in Geography. Her coverage includes climate change, biodiversity, conservation, pollution, land use, sustainable...
Related

Thermal comfort: temperature, humidity, airflow and clothing
How external resistance shapes azo dye removal in microbial fuel cells
Water planning for sustainable growth in constrained catchments

Global limits to growth and pathways to a sustainable future

Imperial moth decline and host ecology on Martha's Vineyard
Abandoned Bomas Create Long-Lived Savanna Fertility Hotspots