







What is biodiversity and why it matters for food and farming
Biodiversity means the spread of difference inside species, among species and across ecosystems, and agriculture leans on it through pollinators, soil life and the genes carried by crops (CBD, 1992; FAO, 2019). Measured losses are real, yet each headline figure counts something different (IPBES, 2019; WWF, 2024).
Farm examples illustrate each level of biodiversity, followed by the services that tie wild organisms to harvests and the narrowing base of crops and breeds. Global assessments by United Nations bodies, field syntheses in peer-reviewed journals and long series of national harvest data supply the evidence, and the final section separates measured findings from estimates.
What biodiversity is and how it is defined
International law takes its definition from a United Nations treaty. That text treats it as variation among organisms of every origin, on land, at sea and in fresh water, and counts differences inside species, among species and among ecosystems (CBD, 1992). In the same document an ecosystem is a working unit in which plant, animal and microbial communities interact with their non-living surroundings (CBD, 1992).
Agricultural agencies keep it shorter. FAO (2019) splits it into three tiers, genes, species and whole ecosystems, and singles out the share that matters to farms, meaning everything in it that feeds the raising of plants and animals or the supply of food. Crops and livestock belong to it. So do bees and other free-living pollinators, soil life, and the parasites and hunters that keep crop pests in check.
Its global assessment drew on 91 national reports written by over 1 300 contributors and on reports from 27 global bodies (FAO, 2019). Many of its trends are reported by governments rather than measured by one monitoring network.
Types of biodiversity with examples from farming
The three levels named in the treaty map directly onto a farm. A single field holds genetic variation within its crop, a mix of species above and below ground, and sits among hedges, wetlands and woodland.
Variation within one species
Two rice varieties, or a hill sheep breed and a commercial one, belong to the same species yet carry different traits. Under the treaty, a species counts as cultivated when humans have influenced its evolutionary process to meet their needs (CBD, 1992). Each variety and breed on a farm exists because of that human selection.
Seed banks store part of this variation as back-up copies. In November 2026 the Svalbard Global Seed Vault listed 1 417 799 seed samples of 6 587 species from 135 depositors (Svalbard Global Seed Vault, 2026). The vault, opened on 26 February 2008, offers long-term storage of seed duplicates from genebanks and nations (Svalbard Global Seed Vault, 2026). The originals stay in those genebanks, and samples are not varieties.
The mix of species in one place
Counting kinds of organism, and their proportions in one place, gives the second level. On farmland that means the crop, weeds, insects, birds, fungi and bacteria. Much of it has never been catalogued: FAO (2019) notes that more than 99 per cent of the world's bacteria and single-celled protists have yet to be described.
Soil holds a large share of that hidden variety. Anthony and colleagues (2023) list Enchytraeidae, small soil worms, as the group with the greatest percentage of species in soil (98.6%), followed by fungi (90%), Plantae (85.5%) and termites, Isoptera (84.2%). The authors conclude that soil is the most biodiverse singular habitat.
Habitats across the farm and beyond
Whole habitats form the broadest level: grassland, woodland, streams and soil, each with the community it supports. The treaty covers ecosystems on land, at sea and in fresh water, together with the larger ecological complexes that contain them (CBD, 1992). On a farm, uncropped strips, ponds and lines of shrubs add places to live that a uniform crop lacks.
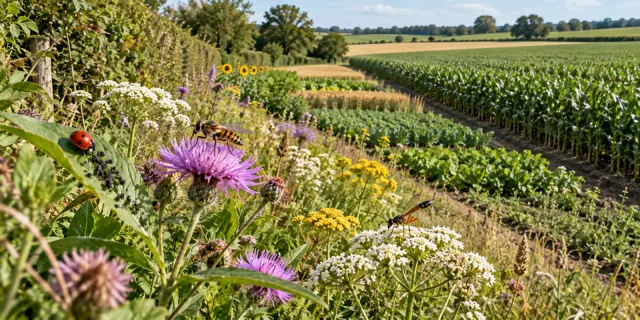
How such variety in farmland affects pests and their predators is covered in [a review of how varied habitats shape insect pests on farms](/environment/biodiversity-insect-pest-management-agroecosystems-environment/), where the shared question is how habitat sustains the natural foes of crop pests. Pollinating insects and soil fauna rely on the same habitats, as the next section shows.
How biodiversity supports food production
Wild species reach the harvest most directly through three services: moving pollen, recycling nutrients underground and keeping pest numbers down. Each has been measured, at different scales and with different certainty.
Pollination
Animal pollination affects a large share of crop types but a smaller share of production volume. According to IPBES (2016), more than three quarters of the leading types of global food crops rely partly on animal pollination for yield or quality, and pollinator-dependent crops contribute to 35 per cent of global crop production volume. IPBES (2016) attributes 60 per cent of global production volume to crops that need no animal pollination, cereals and root crops among them.
The share that can be credited to pollinators directly is smaller again. IPBES (2016) estimates that 5–8 per cent of current global crop production, worth $235 billion to $577 billion a year in 2015 United States dollars, is directly attributable to animal pollination. Dependence varies by crop.
In the crop list analysed by Klein and colleagues (2007), production from 87 of the leading global food crops depended on animal pollination, while 28 did not. Pollinators were essential for 13 crops and production was highly pollinator dependent for 30 (Klein et al., 2007).
Reliance is rising. The volume of production of pollinator-dependent crops increased by 300 per cent over the last five decades (IPBES, 2016).
Soil life
Soil is likely home to 59% of the species on Earth, according to a review of published biodiversity studies by Anthony and colleagues (2023). The figure is an estimate of species whose habitat is soil, not of biomass, and the authors put a wide margin around it.
Those organisms do measurable work for crops. The FAO-led assessment of soil biodiversity (FAO et al., 2020) describes soil organisms as both a source of nutrients for plant growth and the drivers of the transformations that make nutrients available to plants. Soil fauna break plant residues down physically, which lets microorganisms release the nutrients and energy bound up in the plant material (FAO et al., 2020).
Some microbes can stand in for fertiliser in specific systems. Arbuscular mycorrhizal fungi and nitrogen-fixing bacteria can minimise cost and dependence on synthetic nitrogen fertilisers, the same assessment states (FAO et al., 2020). In Brazil, where soybean was cultivated on about 35 million ha in 2018, inoculation with selected Bradyrhizobium strains totally replaced mineral nitrogen fertilisers in soybean production (FAO et al., 2020). The Brazilian result concerns one crop, soybean (FAO et al., 2020).
Natural pest control
In field data, species counts matter for crop services on top of how many individuals there are. Dainese and colleagues (2019) built a global database from 89 studies with 1475 locations and separated the roles of species richness, abundance and dominance for three outcomes: final yields, pollination and the suppression of pests by natural enemies. Where pollinator and pest-predator communities held more species, the richness itself supported those services directly, independent of abundance and dominance (Dainese et al., 2019).
The synthesis also put a ceiling on the role of lost species. Up to 50% of the harm that landscape simplification did to these services was due to richness losses of service-providing organisms, and those losses carried through to lower crop yields (Dainese et al., 2019). That 50% is a maximum share of an effect, not a yield loss (Dainese et al., 2019).
Why a wide mix of crops and breeds keeps harvests steady
Diversity inside the food system is narrower than the count of edible species suggests. According to FAO (2019), greater biological variety helps farms, and the households living from them, ride out disruption of many kinds, climate change included.
A narrowing crop base
Of roughly 382 000 known vascular plants, a little over 6 000 have ever been farmed for eating (FAO, 2019). As of 2014, fewer than 200 species had significant production levels, and by weight just nine of them, cassava, maize, oil-palm fruit, potatoes, rice, soybeans, sugar beet, sugar cane and wheat, made up over 66 per cent of all crop production (FAO, 2019). The measure is weight, not calories or diets.
National diets moved the other way. Khoury and colleagues (2014) found that from 1961 to 2009 homogeneity increased by 16.7%, measured as the mean change in how closely each country matched a common worldwide composition, and mean among-country similarity increased by 35.7%. The result is a food supply relatively species-rich at the national level but species-poor globally (Khoury et al., 2014). They estimated that 50 crop commodities make up the top 90% of what the world gets in calories, protein, tonnage and fat, and come from 94 species of crop drawn from 70 genera (Khoury et al., 2014).
Livestock breeds at risk
Breed records show how much diversity is unmonitored. As of March 2018, 7 745 of the 8 803 breeds recorded by FAO were local breeds, 594 local breeds were extinct, and among extant local breeds 26 per cent were classed as at risk, 7 per cent as not at risk and 67 per cent had no known risk status (FAO, 2019). The unknown share is the largest category.
A separate IPBES count uses a different denominator. By 2016, 559 of the 6,190 domesticated mammal breeds kept for food and farming had become extinct and at least 1,000 more were threatened (IPBES, 2019). The same assessment warns that the loss of local varieties and breeds puts the world's food supply at serious risk, because it weakens how well farming systems cope with pests, pathogens and climate change (IPBES, 2019). The two breed figures cannot be added or compared directly.
FAO data on trend are cautious too. A comparison of 2006 and 2014 shows a slight fall, from 29 to 26 per cent, in the at-risk share of local breeds, a trend FAO says must be interpreted with caution because reporting is incomplete (FAO, 2019).
Diversity and yield stability
The strongest evidence on diversity and steady harvests comes from national statistics. Renard and Tilman (2019) used 5 decades of data on annual yields of 176 crop species in 91 nations. Countries with a more diverse crop mix, measured as effective diversity, had total harvests that were more stable from year to year, an association that reflected markedly lower frequencies of years with sharp harvest losses (Renard and Tilman, 2019). The effects remained robust after controlling for irrigation, fertilisation, precipitation and temperature (Renard and Tilman, 2019).
The finding concerns stability, not higher yields, and it is an association at national scale. Rotations on single farms test a related idea in a smaller setting, described in [how crop rotation works and why it improves soil fertility](/agriculture/how-crop-rotation-works/). The studies below measure different services at different scales.
Study | Data | What was measured | Main finding |
Klein et al., 2007 | Leading global food crops | Crop dependence on animal pollination | 87 leading crops dependent, 28 not |
IPBES, 2016 | Global assessment | Production attributable to pollination | 5–8 per cent of global crop production |
Khoury et al., 2014 | National food supplies, 1961 to 2009 | Similarity of crop composition | Among-country similarity up 35.7% |
Dainese et al., 2019 | 89 studies, 1475 locations | Richness, pollination, pest control, yield | Up to 50% of simplification effects due to richness loss |
Renard and Tilman, 2019 | 176 crops, 91 nations, 5 decades | Year-to-year stability of total harvest | Diversity associated with stability |
Anthony et al., 2023 | Review of published studies | Share of species living in soil | Likely 59% |
Note: the rows measure different quantities and cannot be added into one figure for the food value of biodiversity. Pollination figures describe crop dependence, while the stability figure describes year-to-year variation in national harvests.
What the data show about biodiversity loss
Three indicators dominate reporting on loss, and they answer different questions. One tallies how many species could disappear, another tracks the average trend in monitored animal populations, and a third lists the pressures behind both.
Species at risk
Human actions threaten more species with global extinction now than ever before, according to the IPBES global assessment (IPBES, 2019). Around 25 per cent of species, on average, are threatened in the plant and animal groups assessed so far, suggesting that around 1 million species already face extinction, many within decades, unless the drivers of loss are reduced (IPBES, 2019).
Pollinators show the same gap between groups that are assessed and groups that are not. IUCN Red List assessments indicate that 16.5 per cent of vertebrate pollinators are threatened with global extinction, rising to 30 per cent for island species, and there are no global Red List assessments for insect pollinators (IPBES, 2016). Pollinators living in the wild have become rarer and less diverse at local and regional scales in North West Europe and North America (IPBES, 2016).
Wildlife populations
A population index measures something else. Over 1970 to 2020, the average size of monitored wildlife populations shrank by 73%, based on almost 35,000 population series covering 5,495 vertebrate species, from fish and amphibians to reptiles, mammals and birds (WWF, 2024). The index tracks the average trend in relative abundance rather than declines in the total number of individual animals (WWF, 2024).
The report gives a range of -67% to -78% around the 73% figure, an average annual decline of 2.6% (WWF, 2024). Freshwater populations fell by 85%, terrestrial by 69% and marine by 56% (WWF, 2024). None of these figures counts species lost.
For food species collected from the wild, the data are thinner. In 24 per cent of 4 323 reported cases the wild food is reported to be decreasing in abundance, while in 60 per cent no trend is given or known (FAO, 2019).
Drivers of decline
On land and in fresh water, land-use change has had the largest relative negative impact on nature since 1970, followed by direct exploitation of wild organisms (IPBES, 2019). Farmland expansion is the commonest kind of land-use change, and cropping or livestock now occupy over one third of the land surface (IPBES, 2019).
Population records point the same way. Habitat degradation and loss, driven primarily by the food system, is the most reported threat in each region, with overharvesting, invasive species and disease after it (WWF, 2024). IPBES (2019) adds that soil organic carbon and pollinator diversity have declined and that land degradation has reduced productivity in 23 per cent of the global terrestrial area. Whether organic systems change these pressures is examined in [an analysis of organic and conventional farming economics and ecology](/agriculture/organic-vs-conventional-farming-economics-ecology-agriculture/).
What is proven about biodiversity in farming and what is not
Farming draws on biodiversity through services that have been measured, and global assessments agree that farm-related diversity is shrinking on many fronts (FAO, 2019; IPBES, 2016). How large the losses look depends on the indicator chosen.
Measured services from pollinators, soil life and varied crops underpin food production, yet every headline loss figure counts something different, and none of them sums to one rate of loss.
Several findings rest on direct measurement. Pollination dependence of crops, the concentration of production in a few species and the tie between a country's crop variety and steadier harvests come from crop statistics and field data (IPBES, 2016; FAO, 2019; Renard and Tilman, 2019). The stability result remains an association, and its authors frame diversity as an additional way to address unstable food supplies, alongside other solutions (Renard and Tilman, 2019).
Other figures are estimates. The 1 million species figure combines assessed groups with a tentative estimate of 10 per cent for insects, which IPBES calls a key uncertainty (IPBES, 2019). There are no global Red List assessments for insect pollinators (IPBES, 2016). Soil species estimates carry wide error, and diversity estimates for viruses are highly uncertain (Anthony et al., 2023).
Breed and wild food trends are least certain. FAO (2019) writes that evidence suggests the proportion of livestock breeds at risk is increasing, while its own 2006 and 2014 comparison shows a slight fall for local breeds that it says must be read with caution (FAO, 2019). Two thirds of local breeds have unknown status (FAO, 2019).
Systematic monitoring of insect pollinators and of breeds would close the largest gaps. Until then, statements about how much biodiversity is being lost carry more weight when they specify the indicator, group and period.
Frequently asked questions
How many species live on Earth?
No complete count exists. IPBES (2019) works from an estimated 8 million animal and plant species, 75 per cent of them insects, and suggests that around 1 million are threatened with extinction. Microbes are poorly known: over 99 per cent of bacteria and protist species remain unknown, according to FAO (2019). Totals therefore depend on which groups are included.
What is the main driver of biodiversity loss?
Land-use change. For terrestrial and freshwater ecosystems it has had the largest relative negative impact on nature since 1970, followed by direct exploitation through harvesting, logging, hunting and fishing (IPBES, 2019). Agricultural expansion is the most widespread form of land-use change, with over one third of the land surface used for cropping or animal husbandry (IPBES, 2019).
What is agrobiodiversity?
Agrobiodiversity is the part of biodiversity that serves farming. FAO (2019) calls it biodiversity for food and agriculture: the subset that contributes in one way or another to agriculture and food production. Beyond crops and breeds, it covers pollinators, natural enemies of pests, soil organisms and wild food species, which countries report as declining (FAO, 2019).
How is biodiversity loss measured?
With several indicators that answer different questions. Red List assessments estimate the share of species threatened with extinction, around 25 per cent in assessed groups (IPBES, 2019). The Living Planet Index follows the average trend in relative abundance of monitored vertebrate populations, not the number of animals or species lost (WWF, 2024). The figures cannot be compared directly.
How much of the world’s food depends on pollinators?
It depends on the measure. More than three quarters of leading food crop types rely partly on animal pollination, and these crops contribute to 35 per cent of global crop production volume (IPBES, 2016). The share directly attributable to animal pollination is 5–8 per cent of global crop production (IPBES, 2016).
Sources
- United Nations. Convention on Biological Diversity, Article 2: Use of Terms. Secretariat of the Convention on Biological Diversity; 1992. https://cbd.int/convention/articles/?a=cbd-02
- FAO. The State of the World’s Biodiversity for Food and Agriculture. Bélanger J, Pilling D (eds). FAO Commission on Genetic Resources for Food and Agriculture Assessments. Rome; 2019. ISBN 978-92-5-131270-4. https://fao.org/3/CA3129EN/CA3129EN.pdf
- IPBES. Summary for policymakers of the assessment report of the Intergovernmental Science-Policy Platform on Biodiversity and Ecosystem Services on pollinators, pollination and food production. Potts SG, Imperatriz-Fonseca VL, Ngo HT, et al. (eds). Bonn: IPBES Secretariat; 2016. DOI 10.5281/zenodo.2616458.
- Klein AM, Vaissière BE, Cane JH, et al. Importance of pollinators in changing landscapes for world crops. Proceedings of the Royal Society B: Biological Sciences. 2007;274(1608):303–313. DOI 10.1098/rspb.2006.3721.
- IPBES. Summary for policymakers of the global assessment report on biodiversity and ecosystem services of the Intergovernmental Science-Policy Platform on Biodiversity and Ecosystem Services. Díaz S, Settele J, Brondízio ES, et al. (eds). Bonn: IPBES Secretariat; 2019. DOI 10.5281/zenodo.3553579.
- WWF. Living Planet Report 2024: A System in Peril. Gland, Switzerland: WWF; 2024. ISBN 978-2-88085-319-8. https://files.worldwildlife.org/wwfcmsprod/files/Publication/file/5gc2qerb1v_2024_living_planet_report_a_system_in_peril.pdf
- Khoury CK, Bjorkman AD, Dempewolf H, et al. Increasing homogeneity in global food supplies and the implications for food security. Proceedings of the National Academy of Sciences of the United States of America. 2014;111(11):4001–4006. DOI 10.1073/pnas.1313490111.
- Anthony MA, Bender SF, van der Heijden MGA. Enumerating soil biodiversity. Proceedings of the National Academy of Sciences of the United States of America. 2023;120(33):e2304663120. DOI 10.1073/pnas.2304663120.
- FAO, ITPS, GSBI, SCBD, EC. State of knowledge of soil biodiversity: Status, challenges and potentialities. Summary for policy makers. Rome: FAO; 2020. ISBN 978-92-5-133583-3. DOI 10.4060/cb1929en.
- Renard D, Tilman D. National food production stabilized by crop diversity. Nature. 2019;571(7764):257–260. DOI 10.1038/s41586-019-1316-y.
- Dainese M, Martin EA, Aizen MA, et al. A global synthesis reveals biodiversity-mediated benefits for crop production. Science Advances. 2019;5(10):eaax0121. DOI 10.1126/sciadv.aax0121.
- Svalbard Global Seed Vault. Official website, Norwegian Ministry of Agriculture and Food. Page last modified 19 October 2026. https://seedvault.no/

Maya Ellison — author
Maya Ellison is an environmental science writer for Cabdirect's Environment & Climate section. She holds an MSc in Environmental Science and a BSc in Geography. Her coverage includes climate change, biodiversity, conservation, pollution, land use, sustainable...
Related
Biodiversity for Better Insect Pest Control in Agroecosystems
How crop rotation works and why it improves soil fertility
Organic vs Conventional Farming: Economics and Ecology
Invasive species and why some newcomers take over ecosystems
Keystone species and how one animal can hold an ecosystem together
How consumerism affects the pursuit of sustainable tourism
Acacia Invasion and Cork Oaks in Algeria: Evidence from El Kala