














The green revolution and how new crops changed farming
The green revolution changed world farming by introducing short strawed, high-yielding wheat and rice varieties supported by fertiliser, irrigation and state purchasing (Evenson & Gollin, 2003). It is best described as a package rather than a single invention: the varieties were bred from the late 1950s and released to farmers from the mid 1960s. Over roughly five decades grain output in the developing world tripled while the cultivated area grew by only about 30% (Pingali, 2012).
How much of that belongs to the seeds is measured in several different ways, and the answers do not fully agree. This explainer follows where the varieties came from, how far they spread, what the published estimates actually claim, and what the gains cost in water, nitrogen and crop mix.
What the green revolution actually was
Deliberate breeding of modern varieties for developing countries began in the late 1950s, and the wheat and rice varieties that gave the green revolution its name were bred in the middle 1960s and released to farmers in Latin America and Asia (Evenson & Gollin, 2003). Two international centres did most of the early work: one in Mexico for wheat and maize, the other in the Philippines for rice. By 2003 sixteen such centres employed about 8,500 scientific staff on an annual budget of around 340 million US dollars (Evenson & Gollin, 2003).
Periodisation differs between authors, which is worth saying plainly. Pingali dates the first green revolution to 1966 to 1985, while Evenson and Gollin split the record into an early phase from 1961 to 1980 and a late phase from 1981 to 2000, and argue that it was a long rise in the rate of productivity growth rather than one jump (Pingali, 2012; Evenson & Gollin, 2003).
Short straw and the wheat genes
The dwarfing alleles in the wheats released at that time are known as the green revolution genes, and the molecular explanation for them arrived long after the trait itself was in the field. The wheat loci Rht-B1 and Rht-D1 turned out to encode mutant growth repressors that the plant cannot break down in response to gibberellin, so the stem stops extending (Peng et al., 1999).
Three linked effects explain why that mattered in the field. Tall traditional wheats fed with nitrogen grew long stems and fell over, so the extra fertiliser cost yield instead of adding it. Short straw held the crop upright, moved a larger share of the plant's biomass into grain, and made the varieties more responsive to fertiliser than the types they replaced (Evenson & Gollin, 2003).
IR8 and the rice side
The rice equivalent, IR8, was a semi-dwarf selected from a cross made at the Philippine centre, and its short thick stem lodged less. Its short stature was later traced to a mutation in the sd1 gene, which encodes an enzyme in the gibberellin biosynthesis pathway (Sasaki et al., 2002). Wheat and rice therefore arrived at the same shape through different damage to the same hormone system: one cannot sense the hormone, the other cannot make enough of it.
The package beyond the seed
The seed only worked inside a system. Fertiliser, controlled water, guaranteed prices and state purchasing were all part of it, and where any of them was missing the varieties underperformed. Wheat varieties raised yields by roughly 40% on irrigated land but by no more than 10% in dry districts, and adoption followed water availability almost exactly (Pingali, 2012).
How far the new varieties spread
Adoption is the part of the record with the least disagreement, because it was counted rather than modelled. Across all developing countries the share of crop area under modern varieties rose from 9% in 1970 to 63% by 1998. Within that average the gap is the story: Asia reached 82% by 1998, while sub-Saharan Africa reached 27% (Pingali, 2012).
That figure of 27% is often quoted as a figure for Africa as a whole, which it is not. It covers sub-Saharan Africa; the Middle East and North Africa reached 58% in the same year. National cereal yields show the same split, and they also show how slowly the gap closed (World Bank, 2026).
Country or region | 1961 | 1980 | 2000 | 2023 |
Mexico | 1,105 | 2,191 | 2,761 | 4,262 |
India | 947 | 1,350 | 2,287 | 3,602 |
Pakistan | 856 | 1,613 | 2,404 | 3,626 |
Philippines | 996 | 1,606 | 2,581 | 3,869 |
Sub-Saharan Africa | 806 | 1,064 | 1,126 | 1,570 |
World | 1,422 | 2,297 | 3,061 | 4,229 |
Note: these are national cereal yields in kilograms per hectare, averaged over all cereals and all causes, not a measure of what plant breeding on its own contributed (World Bank, 2026). India's 1965 figure, often used as the starting point in popular accounts, was depressed by drought, which makes any growth measured from it look steeper than it was.
The pace of variety release also contradicts the common idea that the revolution ended in the 1970s. By 2000 more than 8,000 modern varieties had been released across eleven crops, by over 400 public breeding programmes in more than 100 countries (Evenson & Gollin, 2003). In the late period, from 1981 to 2000, modern varieties accounted for close to half of yield growth across developing countries, against about a fifth in the early period (Evenson & Gollin, 2003).
What is proven about the green revolution, and what remains uncertain?
The headline claims about the green revolution are counterfactual: they describe a world that did not happen. That is not a weakness as long as it is stated. Each estimate comes from a particular model with particular assumptions, and the figures from different studies cannot be added together.
What the counterfactual studies claim
The standard estimate uses a multi-market model in which developing countries receive no yield gains from breeding between 1965 and 2000. In that scenario their yields are 19.5 to 23.5% lower, crop prices worldwide are 35 to 66% higher, and calorie supply per head in developing countries is 13.3 to 14.4% lower, which the authors translate into the health status of 32 to 42 million preschool children (Evenson & Gollin, 2003).
Two later studies use observed data rather than a market model. A panel of 84 countries found that a 10 percentage point rise in the area under high-yielding varieties raised income per head by roughly 15%, with about 60% of that coming from farm productivity and 40% from workers moving out of agriculture (Gollin et al., 2021). A study of more than 600,000 births in 37 countries found that the spread of modern varieties cut infant mortality by 2.4 to 5.3 percentage points from a base of 18% (von der Goltz et al., 2020).
Where the estimates disagree
Land sparing is the clearest case. One widely cited study puts the cropland saved by 2004 at 17.9 to 26.7 million hectares, with about 2 million hectares of avoided forest conversion, and its authors say directly that this is of much smaller magnitude than Borlaug proposed (Stevenson et al., 2013). They also call their forest figures unreliable, because the confidence intervals include zero.
Work by part of the same group separates intensification driven by lower costs from intensification driven by high prices, and finds that the second is often a main cause of area expansion and deforestation, especially for export crops (Byerlee et al., 2014). Direction and size are therefore different questions here, and for some crops even the sign can change.
The direction of the effect is reasonably well supported. The size of it depends on which counterfactual world the model is asked to build, and those worlds are not the same.
Two further cautions belong with these numbers. The estimates are not independent of one another: later summaries restate the earlier market model, and the land sparing study takes productivity estimates from that same body of work as its input shock (Pingali, 2012; Stevenson et al., 2013). Several of the authors also had institutional ties to the research system being assessed, which they disclose, and which is worth knowing without treating it as a reason to discard the figures.
Four results hold across independent methods. Yields and output rose, with breeding contributing a large share of that rise; food prices fell and consumers gained; infant mortality fell where modern varieties spread; and the gains were unevenly distributed across regions and farming systems (Evenson & Gollin, 2003; Gollin et al., 2021; von der Goltz et al., 2020).
Three things remain genuinely open. How much land the productivity gains spared is disputed by an order of magnitude (Stevenson et al., 2013; Byerlee et al., 2014). Whether the environmental damage should be attributed to the technology or to the subsidies around it is an argument about interpretation, not about measurements. And claims about lives saved on the scale of a billion have no published estimate behind them at all.
What the gains cost
The costs are real and well documented, but they are easier to misattribute than the benefits. Pingali, who is favourable to the technology, argues that the environmental consequences were not caused by the technology itself but by subsidies on fertiliser, pesticides and irrigation water and by output price support (Pingali, 2012). Critics locate them in the structure of the innovation system. That is a disagreement about attribution, not about the data.
There is also a distributional cost that the technology's own supporters state most clearly. Farmers who did not get the yield gains still met the falling crop prices that the gains produced, and so lost income in real terms (Evenson & Gollin, 2003). Poorer and rain-fed districts gained more slowly, and women farmers gained proportionally less, because extension and input delivery were aimed at men (Pingali, 2012).
Water in northern India
Satellite gravity measurements found groundwater under Rajasthan, Punjab and Haryana falling by 17.7 cubic kilometres a year between 2002 and 2008, a total loss of 109 cubic kilometres (Rodell et al., 2009). The authors note that six years is a short period from which to judge a long-term trend.
Measurements from about 3,500 wells give a different picture of the wider basin: water levels were stable or rising across 70% of the Indo-Gangetic aquifer between 2000 and 2012, with depletion concentrated around large cities, and the binding problem was contamination rather than depletion (MacDonald et al., 2016). The two results cover different areas, periods and methods, and both belong in any honest summary.
Nitrogen and falling returns
Global nitrogen use efficiency, the share of applied nitrogen that leaves the field in the harvest, fell from about 68% in the early 1960s to about 45% by 1980 and has sat near 47% since, while synthetic nitrogen application rose ninefold (Lassaletta et al., 2014). For India and China the same analysis finds that additional nitrogen now adds very little yield without wider changes in agronomy. Work on [fertiliser type and rice yield](/agriculture/fertilizer-types-rice-yield-soil-properties-sri-agriculture/) sits in that gap.
The contrast that makes the point is the Netherlands, where nitrogen application has returned to 1960s levels while yields are roughly double (Lassaletta et al., 2014). Breaking the link with nitrogen proved possible, but it took different agronomy rather than different varieties. Comparisons of [organic and conventional systems](/agriculture/organic-vs-conventional-farming-economics-ecology-agriculture/) test the same question from the other side.
Crop mix and genetic diversity
The common claim that the green revolution destroyed the genetic base of crops does not survive the best available evidence. A meta-analysis of 44 studies across eight field crops found a significant 6% drop in the diversity of released cultivars in the 1960s compared with the 1950s, but no gradual long-term narrowing afterwards, because breeders widened their material again (van de Wouw et al., 2010).
What did narrow was the set of crops actually grown. In India, with the monsoon cereal area almost unchanged between 1966 and 2011, rice rose from 52% to 67% of that harvested area (Davis et al., 2019). Modelled reversals of that shift raise iron supply and cut irrigation demand, but the authors call them thought experiments rather than recommendations. Narrowed crop mix and narrowed genetics are two different claims, and they are routinely merged.
From high-yielding varieties to modern breeding
The link to today's biotechnology is sharper than it looks, and it runs through what the breeders did not know. The causal genes behind the trait that defined the whole period were identified only in 1999 for wheat and 2002 for rice (Peng et al., 1999; Sasaki et al., 2002). Breeders moved those genes successfully for roughly thirty years before anyone could name them.
What carried over
The method carried over in substance: select on the visible plant, keep what performs, and multiply it. That is still how most varieties reach farmers, including in tree and plantation crops, where [clonal selection in rubber](/agriculture/hevea-brasiliensis-breeding-clonal-selection-biotechnology-agriculture/) follows the same logic over much longer cycles. The focus on a few starchy staples carried over too, and so did the dependence on purchased inputs and water (Pingali, 2012).
What is different now
Genetic engineering and genome editing usually work from a known sequence rather than from the visible plant alone, which is why laboratory [detection methods for modified crops](/research/rapid-detection-methods-for-genetically-modified-agricultural-products/) exist at all: the change is defined in advance and can be looked for. Green revolution breeding left no inserted construct of that kind to look for.
What this has delivered so far is narrower than the publicity suggests. A United States academies committee concluded that there was no evidence that engineered crops had changed the rate of increase in yields, that insect-resistant crops raised yields where pest pressure was high, and that it found no substantiated evidence of a difference in human health risk against conventionally bred crops (NASEM, 2016).
The same committee noted that new techniques have blurred the distinction between engineering and conventional breeding, and recommended assessing new varieties by the traits of the product rather than the process that produced them (NASEM, 2016). That recommendation is the clearest statement of what the green revolution left behind: a record showing that the useful question about a new variety is what it does in the field, under which conditions, and at whose cost.
Frequently asked questions
Was the green revolution good or bad?
Neither label fits the published record. Yields, food output and incomes rose, food prices fell and infant mortality dropped, while groundwater, nitrogen efficiency and crop mix suffered in particular regions. The benefits and the costs landed on different people, which is why the same evidence supports opposite summaries and still does.
Who was Norman Borlaug?
Borlaug was the plant breeder who developed the short strawed, disease resistant wheats in Mexico that were released across South Asia in the mid 1960s, and he received the Nobel Peace Prize in 1970. His own estimates of how much land the new varieties spared are far larger than later modelling supports.
Why did shorter straw raise yields?
Tall wheat and rice fed with nitrogen grew long stems and collapsed before harvest, so fertiliser lowered yields instead of raising them. Shorter stems stayed upright, put a larger share of the plant into grain rather than straw, and let farmers use fertiliser at rates the older varieties could not stand.
Why did it not reach Africa?
By 1998 only about a quarter of cropped area in sub-Saharan Africa carried modern varieties (Pingali, 2012). The region's farming depends mostly on rain rather than irrigation, its main staples were not the focus of early breeding, and output there grew mainly by expanding the area cultivated rather than by raising yields.
Is the green revolution over?
Varietal improvement did not stop in the 1970s: more than 8,000 modern varieties had been released across eleven crops by 2000, and modern varieties contributed more to yield growth after 1980 than before (Evenson and Gollin, 2003). What changed is that selection on the visible plant now sits alongside methods that begin from known sequences.
Sources
- Evenson RE, Gollin D. Assessing the impact of the Green Revolution, 1960 to 2000. Science. 2003;300(5620):758-762. DOI 10.1126/science.1078710.
- Pingali PL. Green Revolution: impacts, limits, and the path ahead. Proceedings of the National Academy of Sciences. 2012;109(31):12302-12308. DOI 10.1073/pnas.0912953109.
- Gollin D, Hansen CW, Wingender AM. Two blades of grass: the impact of the Green Revolution. Journal of Political Economy. 2021;129(8):2344-2384. DOI 10.1086/714444.
- von der Goltz J, Dar A, Fishman R, Mueller ND, Barnwal P, McCord GC. Health impacts of the Green Revolution: evidence from 600,000 births across the developing world. Journal of Health Economics. 2020;74:102373. DOI 10.1016/j.jhealeco.2020.102373.
- Stevenson JR, Villoria N, Byerlee D, Kelley T, Maredia M. Green Revolution research saved an estimated 18 to 27 million hectares from being brought into agricultural production. Proceedings of the National Academy of Sciences. 2013;110(21):8363-8368. DOI 10.1073/pnas.1208065110.
- Byerlee D, Stevenson J, Villoria N. Does intensification slow crop land expansion or encourage deforestation? Global Food Security. 2014;3(2):92-98. DOI 10.1016/j.gfs.2014.04.001.
- Rodell M, Velicogna I, Famiglietti JS. Satellite-based estimates of groundwater depletion in India. Nature. 2009;460(7258):999-1002. DOI 10.1038/nature08238.
- MacDonald AM, Bonsor HC, Ahmed KM, et al. Groundwater quality and depletion in the Indo-Gangetic Basin mapped from in situ observations. Nature Geoscience. 2016;9(10):762-766. DOI 10.1038/ngeo2791.
- Lassaletta L, Billen G, Grizzetti B, Anglade J, Garnier J. 50 year trends in nitrogen use efficiency of world cropping systems: the relationship between yield and nitrogen input to cropland. Environmental Research Letters. 2014;9(10):105011. DOI 10.1088/1748-9326/9/10/105011.
- Davis KF, Chhatre A, Rao ND, et al. Assessing the sustainability of post-Green Revolution cereals in India. Proceedings of the National Academy of Sciences. 2019;116(50):25034-25041. DOI 10.1073/pnas.1910935116.
- van de Wouw M, van Hintum T, Kik C, van Treuren R, Visser B. Genetic diversity trends in twentieth century crop cultivars: a meta analysis. Theoretical and Applied Genetics. 2010;120(6):1241-1252. DOI 10.1007/s00122-009-1252-6.
- Peng J, Richards DE, Hartley NM, et al. Green revolution genes encode mutant gibberellin response modulators. Nature. 1999;400(6741):256-261. DOI 10.1038/22307.
- Sasaki A, Ashikari M, Ueguchi-Tanaka M, et al. Green revolution: a mutant gibberellin-synthesis gene in rice. Nature. 2002;416(6882):701-702. DOI 10.1038/416701a.
- National Academies of Sciences, Engineering, and Medicine (NASEM). Genetically Engineered Crops: Experiences and Prospects. Washington, DC: The National Academies Press; 2016. DOI 10.17226/23395.
- World Bank. World Development Indicators, indicator AG.YLD.CREL.KG, cereal yield in kilograms per hectare. Washington, DC. data.worldbank.org/indicator/AG.YLD.CREL.KG. Data retrieved 2026.

Harriet Colbeck — author
Harriet Colbeck is an agriculture writer with a background in agricultural science and a master’s-level focus on soil science. Her earlier work involved preparing field-trial summaries and farmer-facing guidance on soil management, translating research finding...
Related
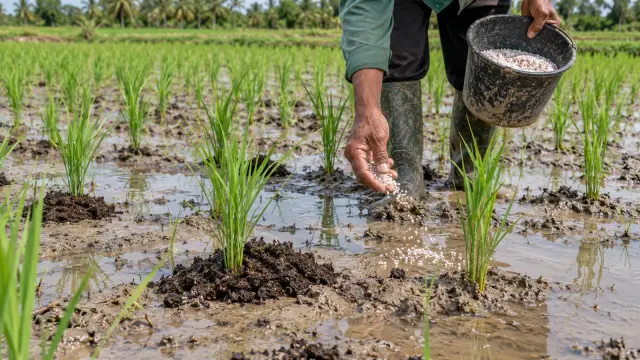
How fertiliser types affect rice yield and soil under SRI
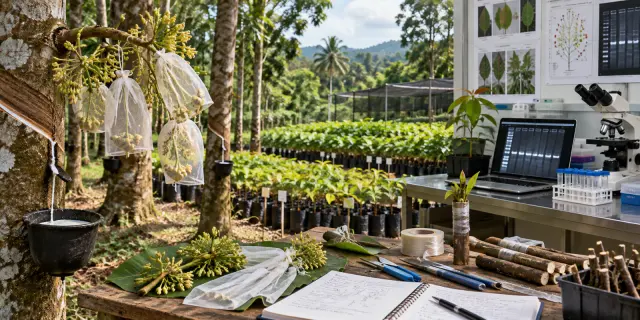
Hevea brasiliensis breeding: from crosses to field trials
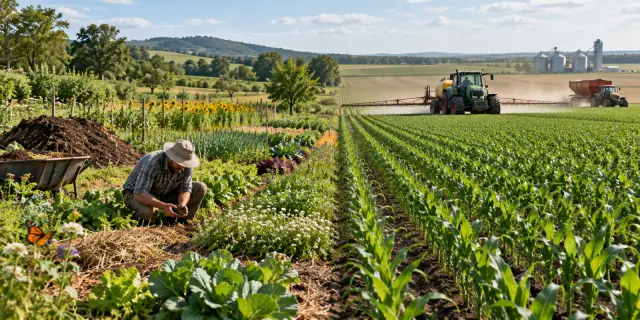
Organic vs Conventional Farming: Economics and Ecology
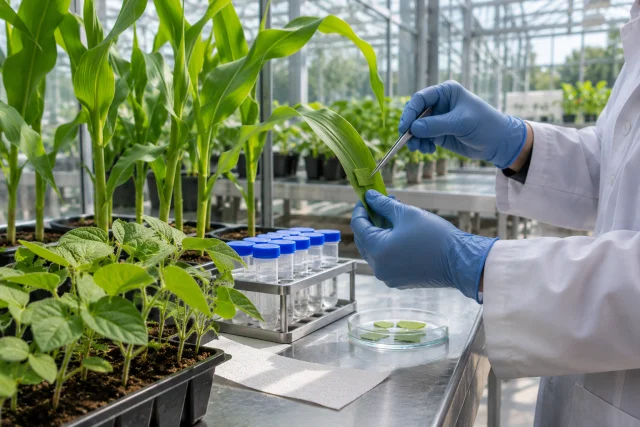
What GMO means and what research shows about genetically modified food
Glyphosate’s Rise to Top Weedkiller: A 1997 Account
Subsistence farming and how families grow food to feed themselves
No-till farming and what long-term field trials show about yields